Foundation Financials
SickKids Foundation is committed to the highest standards of accountability and transparency.
We were among the first nationally accredited charities under Imagine Canada’s Standards Program. Click below to download SickKids Foundation’s audited financials.
Download audited financials
| Sources of Revenue (in Millions) | Amount |
|---|---|
| Gross fundraising program, net lottery and net parking revenue | $240 million |
| Total grants and charitable activity (see below) | $127 million |
| Fundraising and administrative expenses | $71 million |
| Measure | 1 Year | 3 Years | 5 Years | 10 Years | Since Inception |
|---|---|---|---|---|---|
| Annualized rate of return percentage | 9.7% | 9.8% | 7% | 6.3% | 9.2% |
| Percentile ranking* | Top 80% | Top 80% | Top 70% | Top 70% | Top 1% |
Source of Revenue
(in millions)
Gross fundraising program, net lottery and net parking revenue
$240
Total grants and charitable activity (see below)
$127
Fundraising and administrative expenses
$71
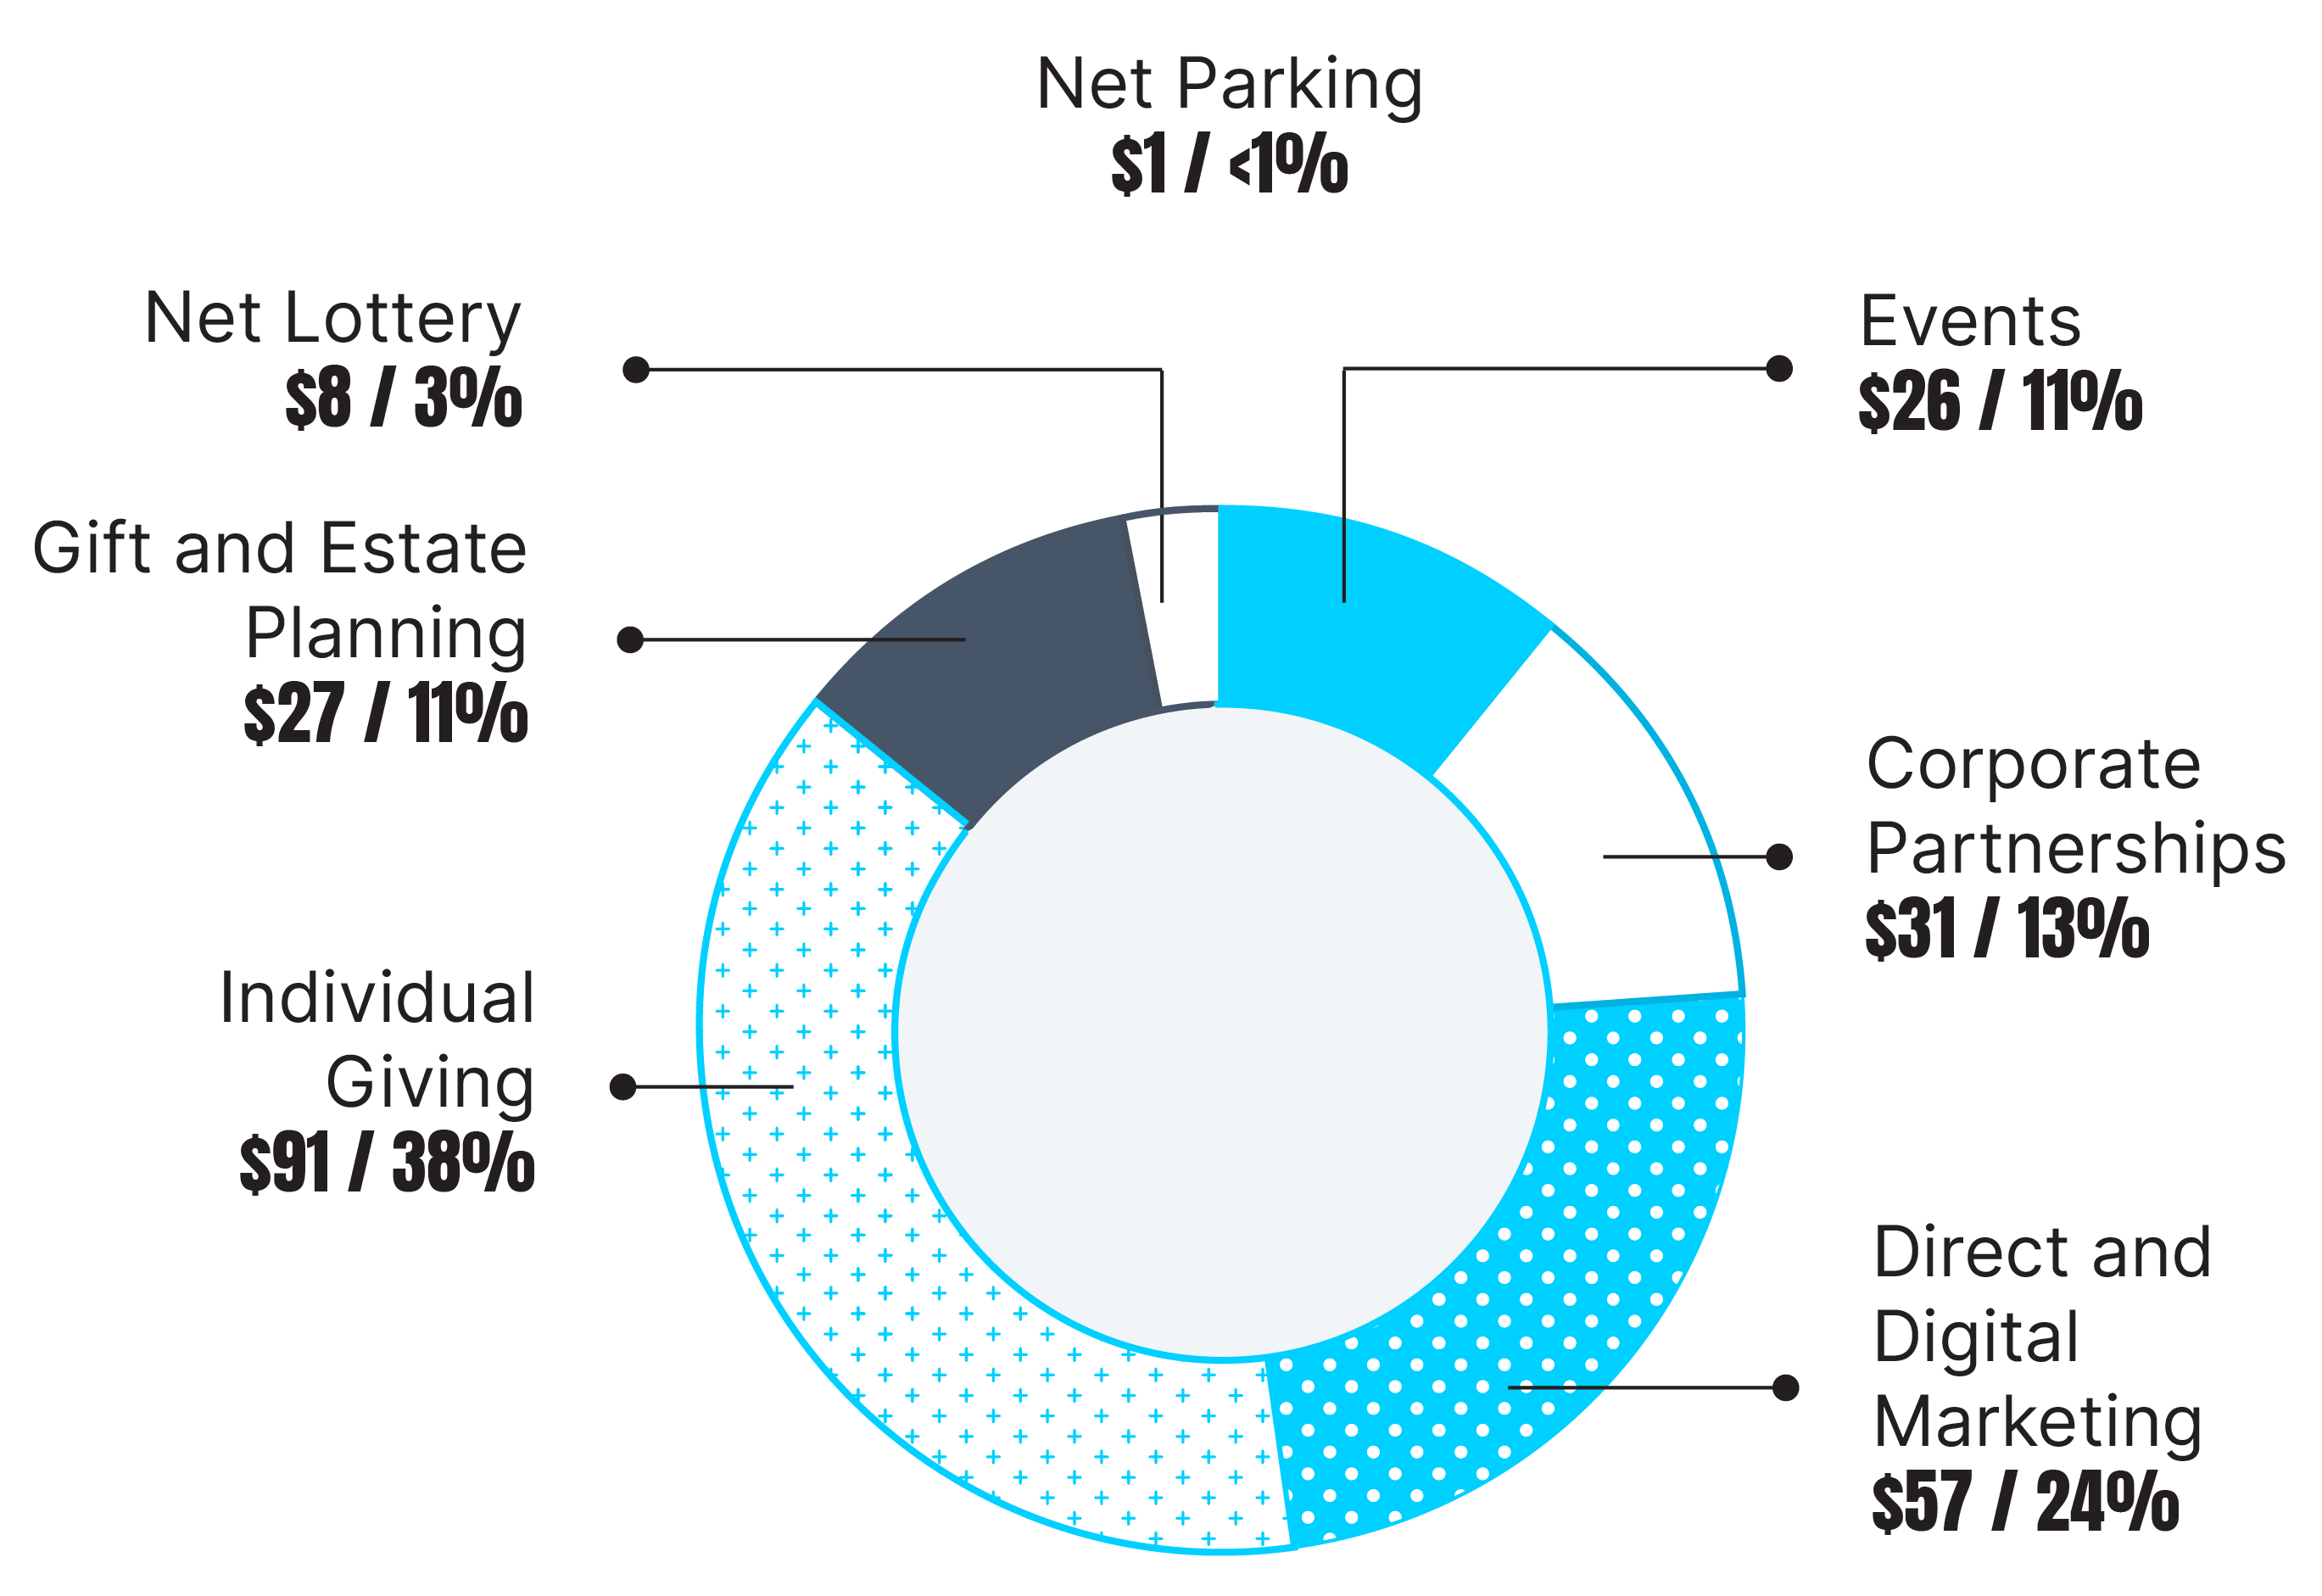
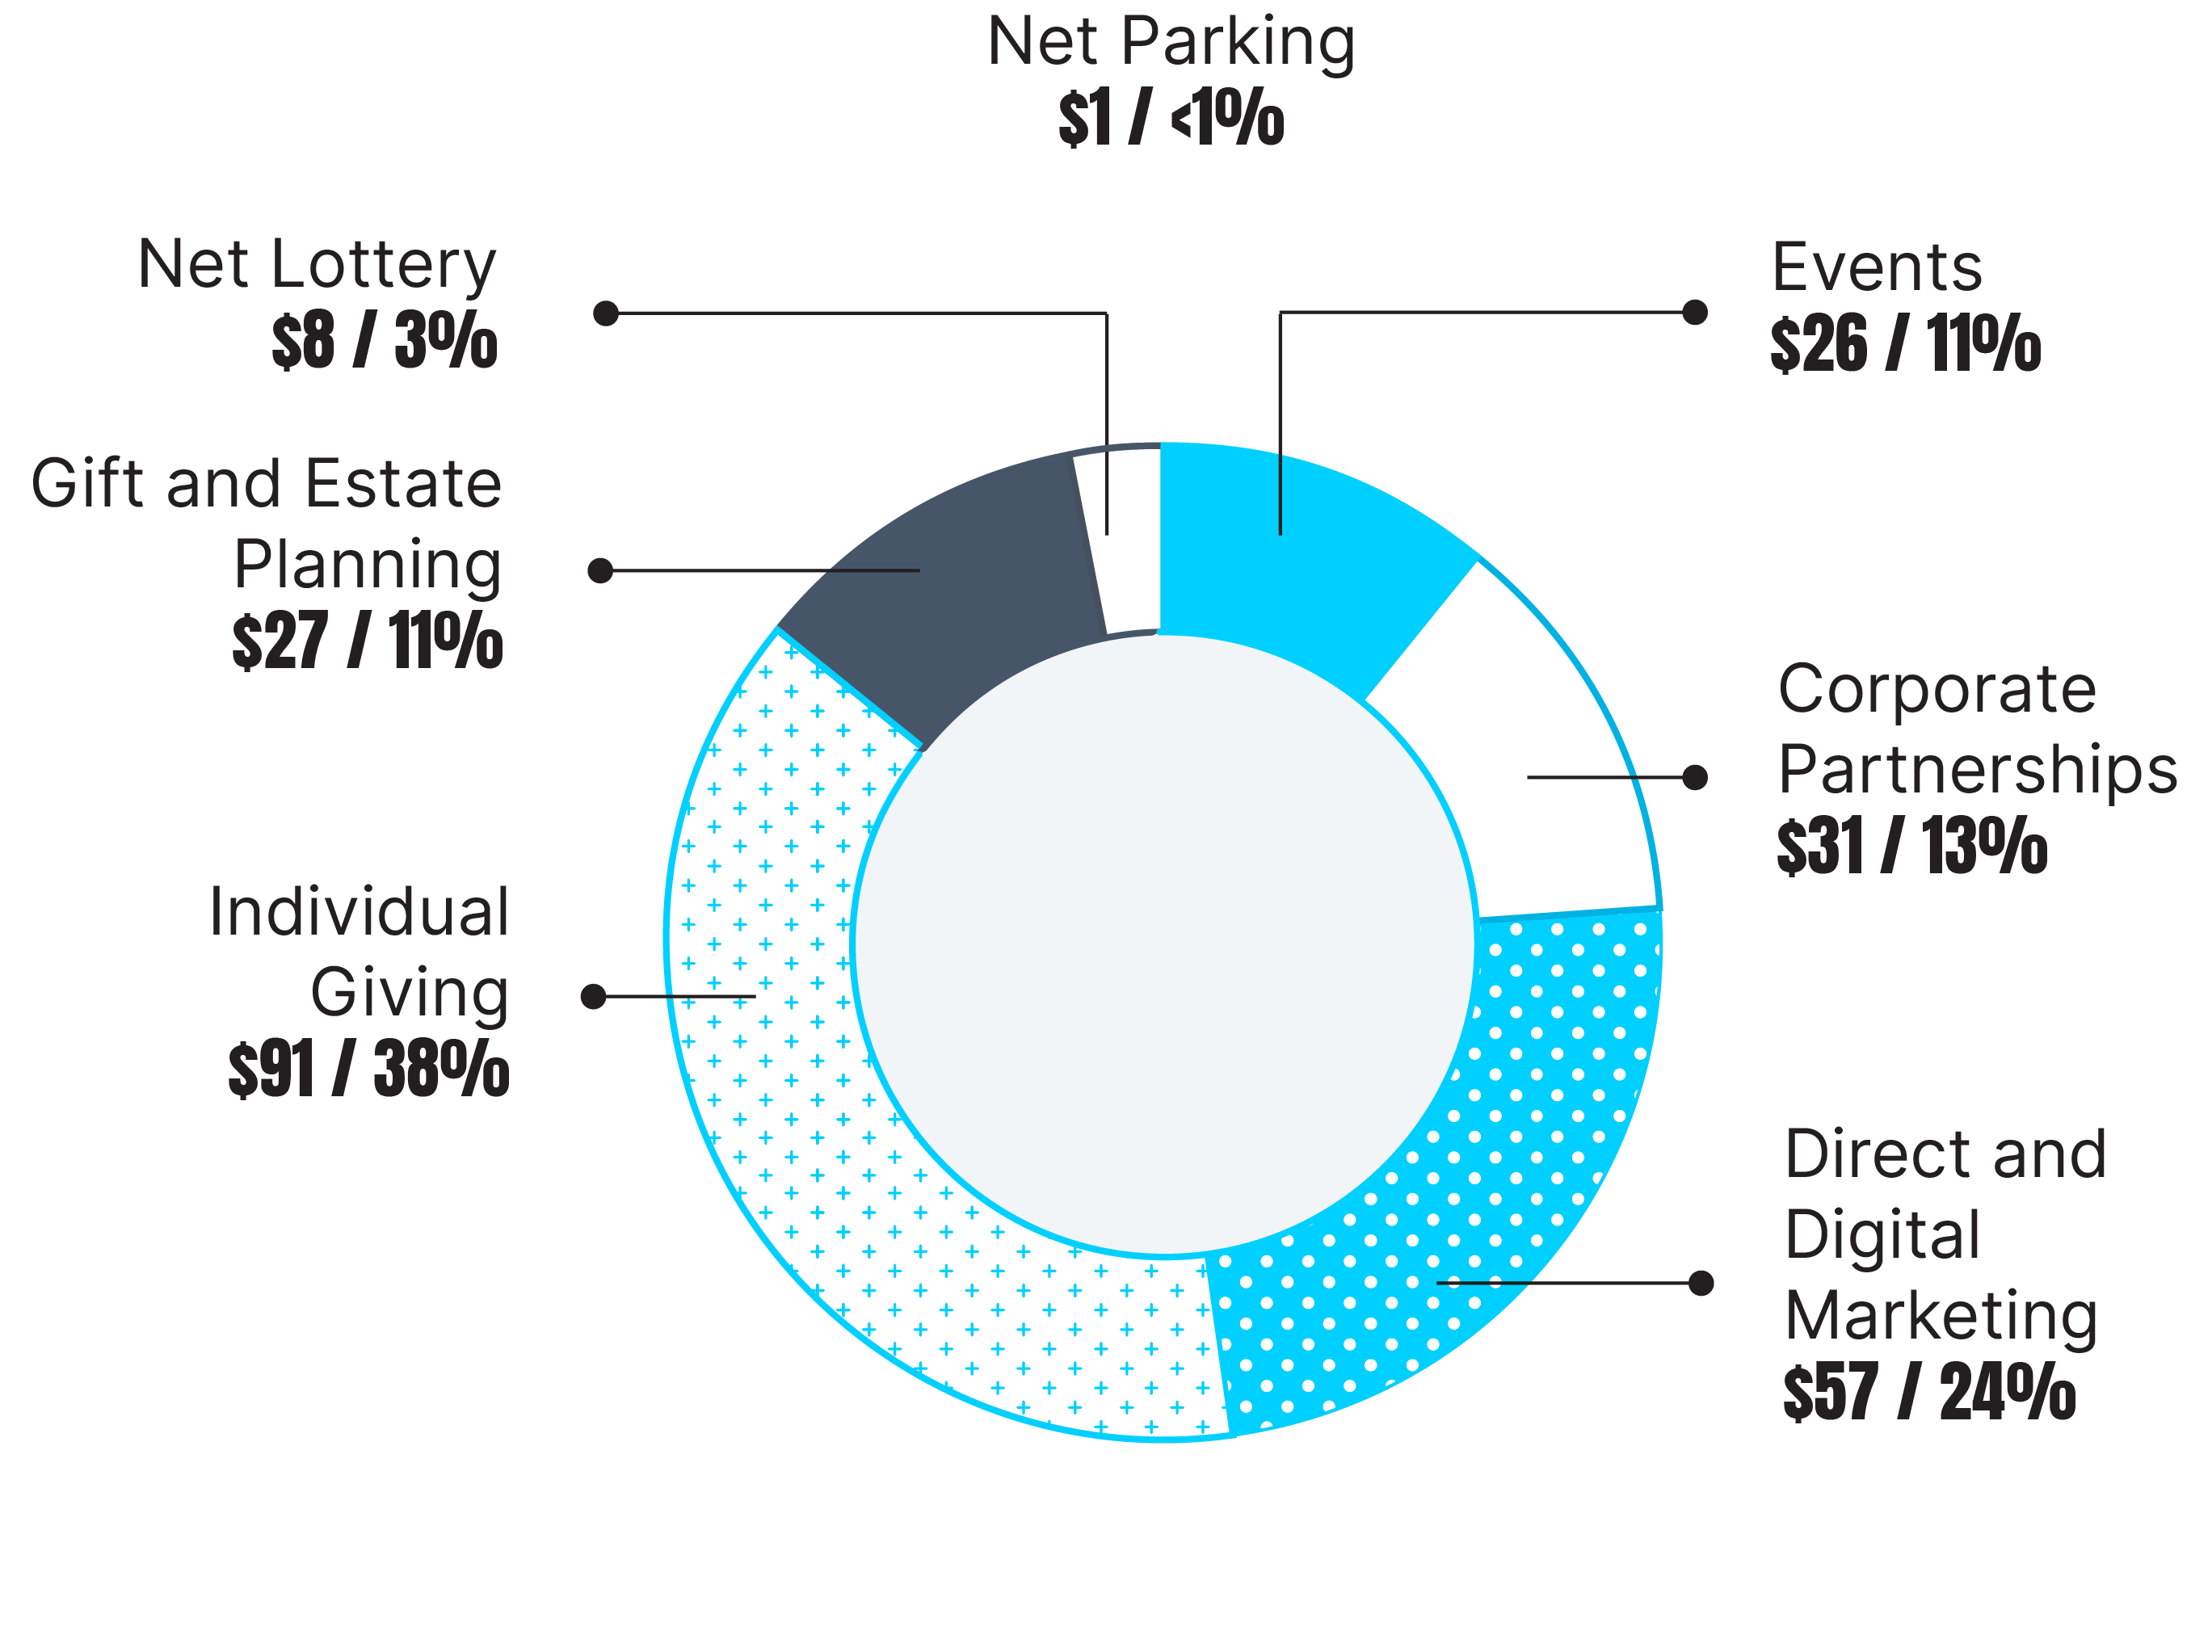
| Sources of Revenue | Amount in Millions | Percentage of Total Revenue |
|---|---|---|
| Events | $26 million | 11% |
| Corporate Partnerships | $31 million | 13% |
| Direct and Digital Marketing | $57 million | 24% |
| Individual Giving | $91 million | 38% |
| Gift and Estate Planning | $27 million | 11% |
| Net Lottery | $8 million | 3% |
| Net Parking | $1 million | <1% |
Investments in Child Health
Grants and charitable activity
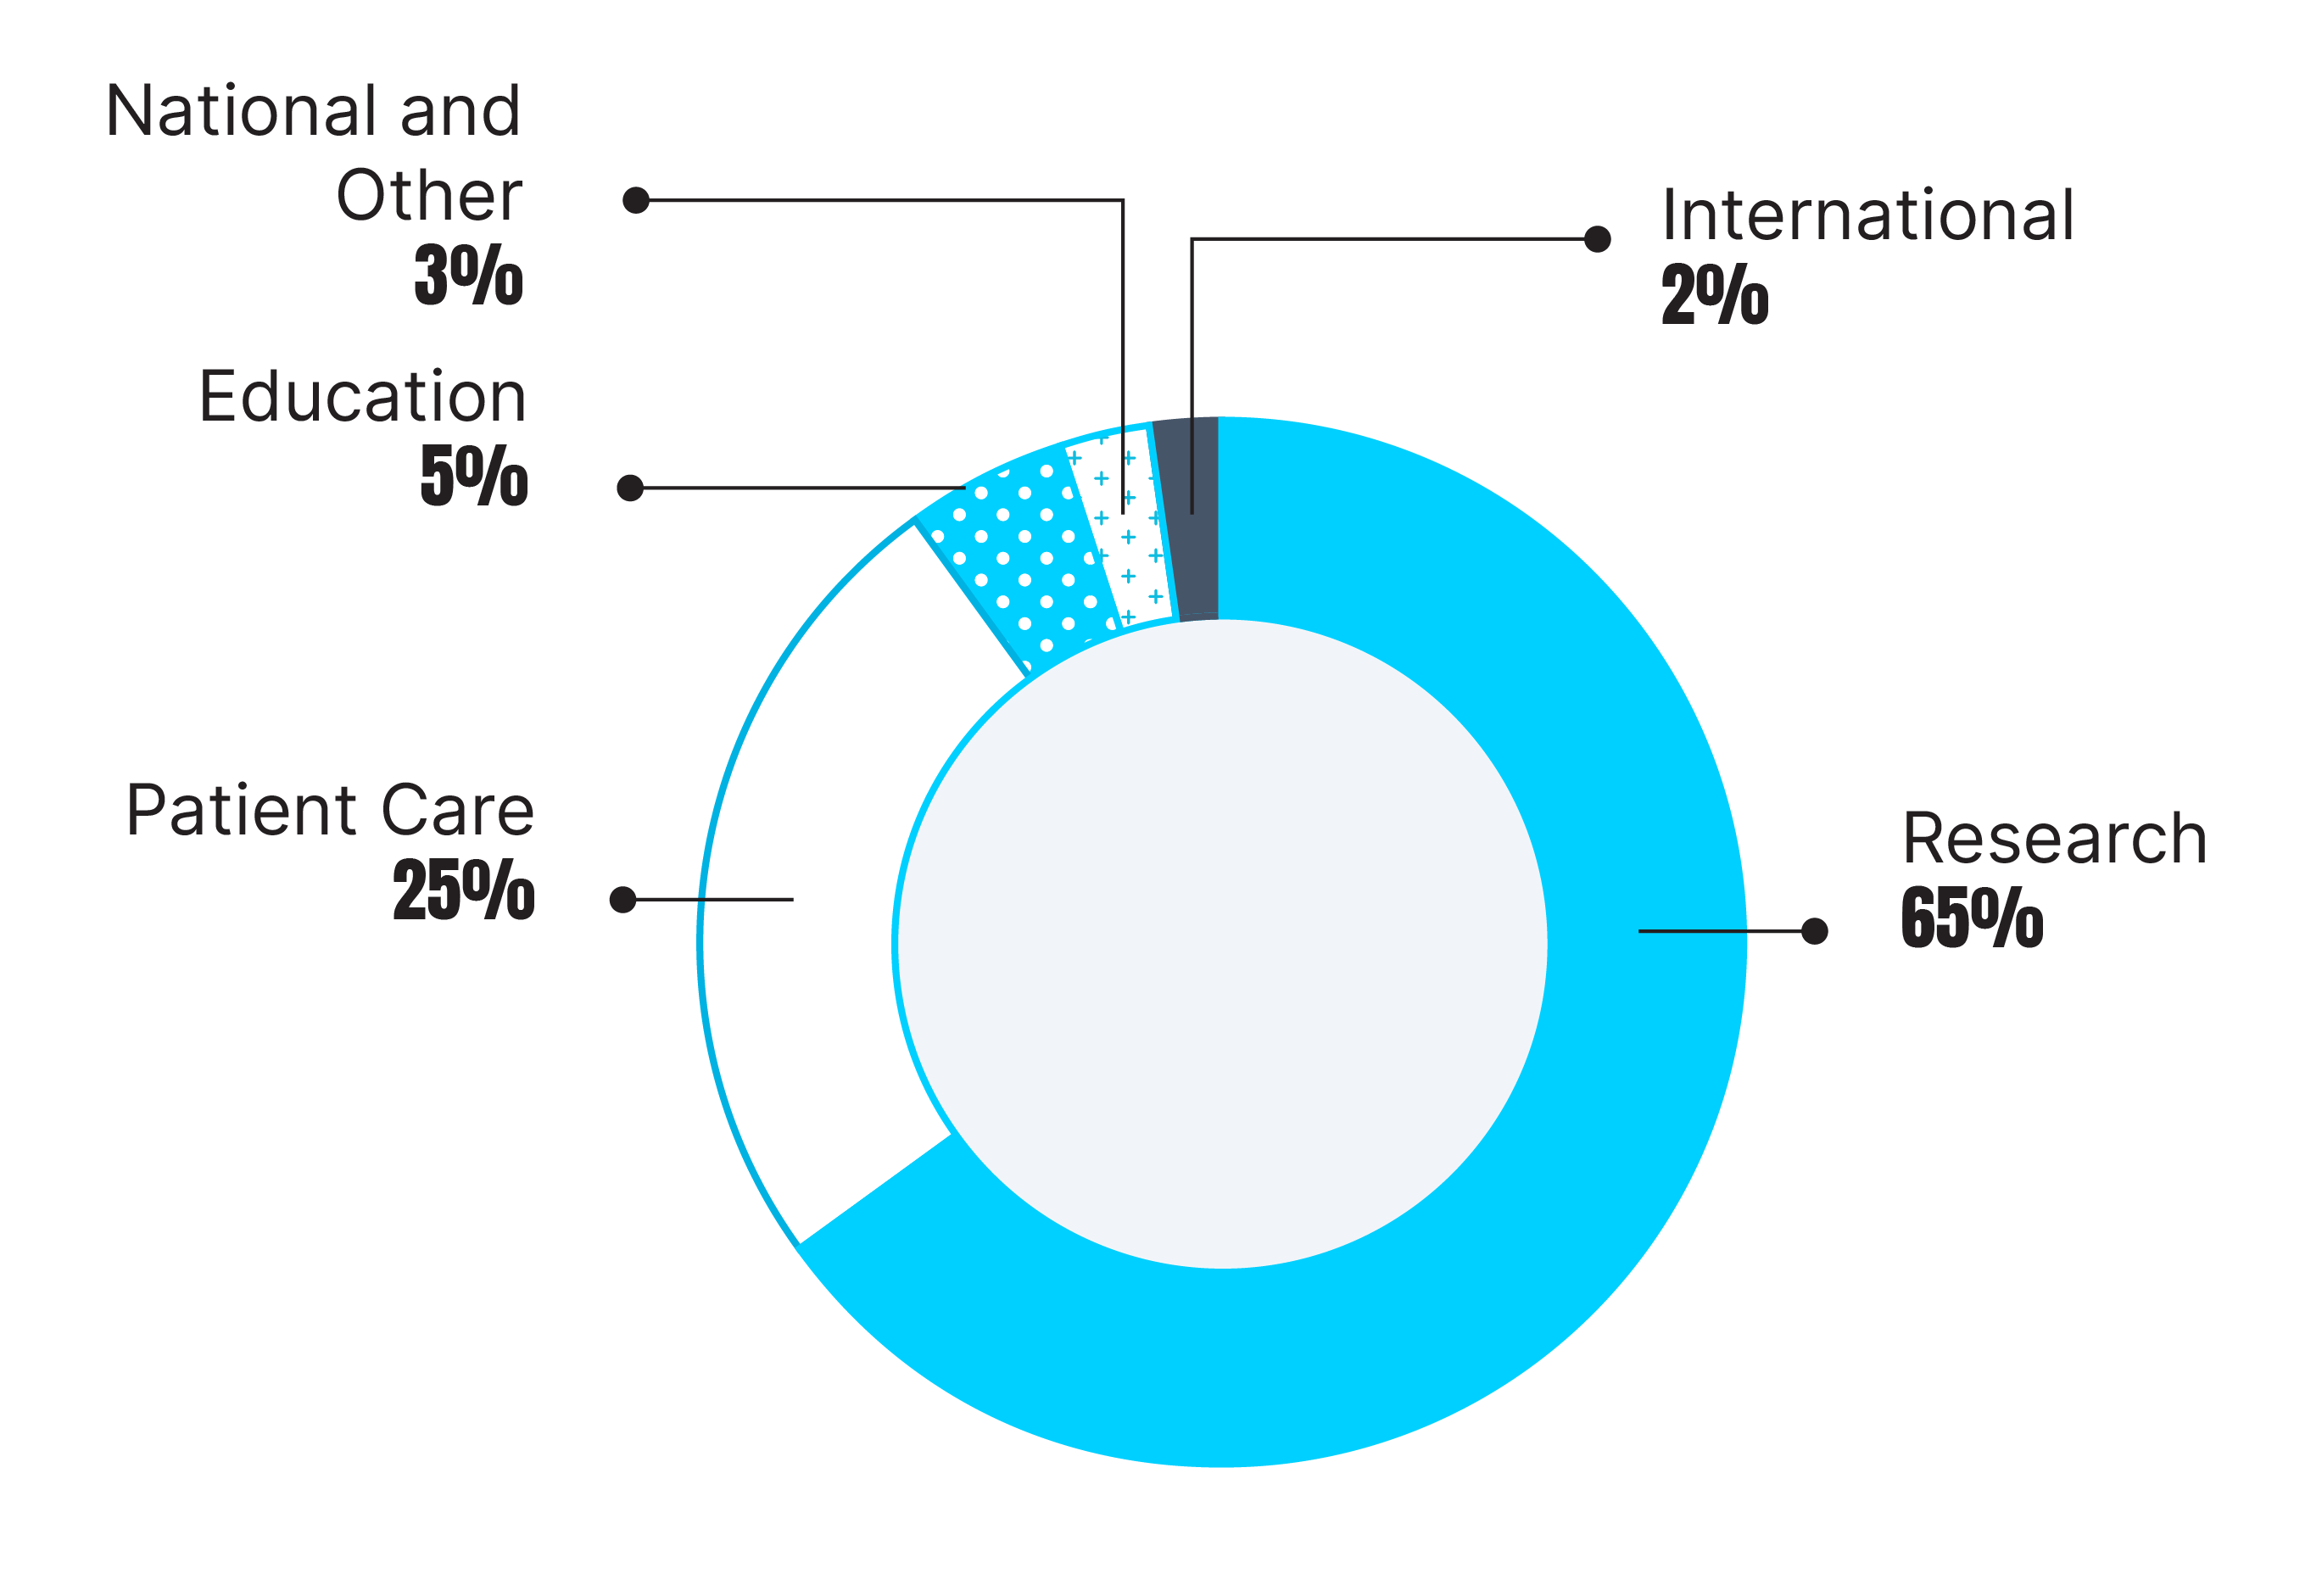
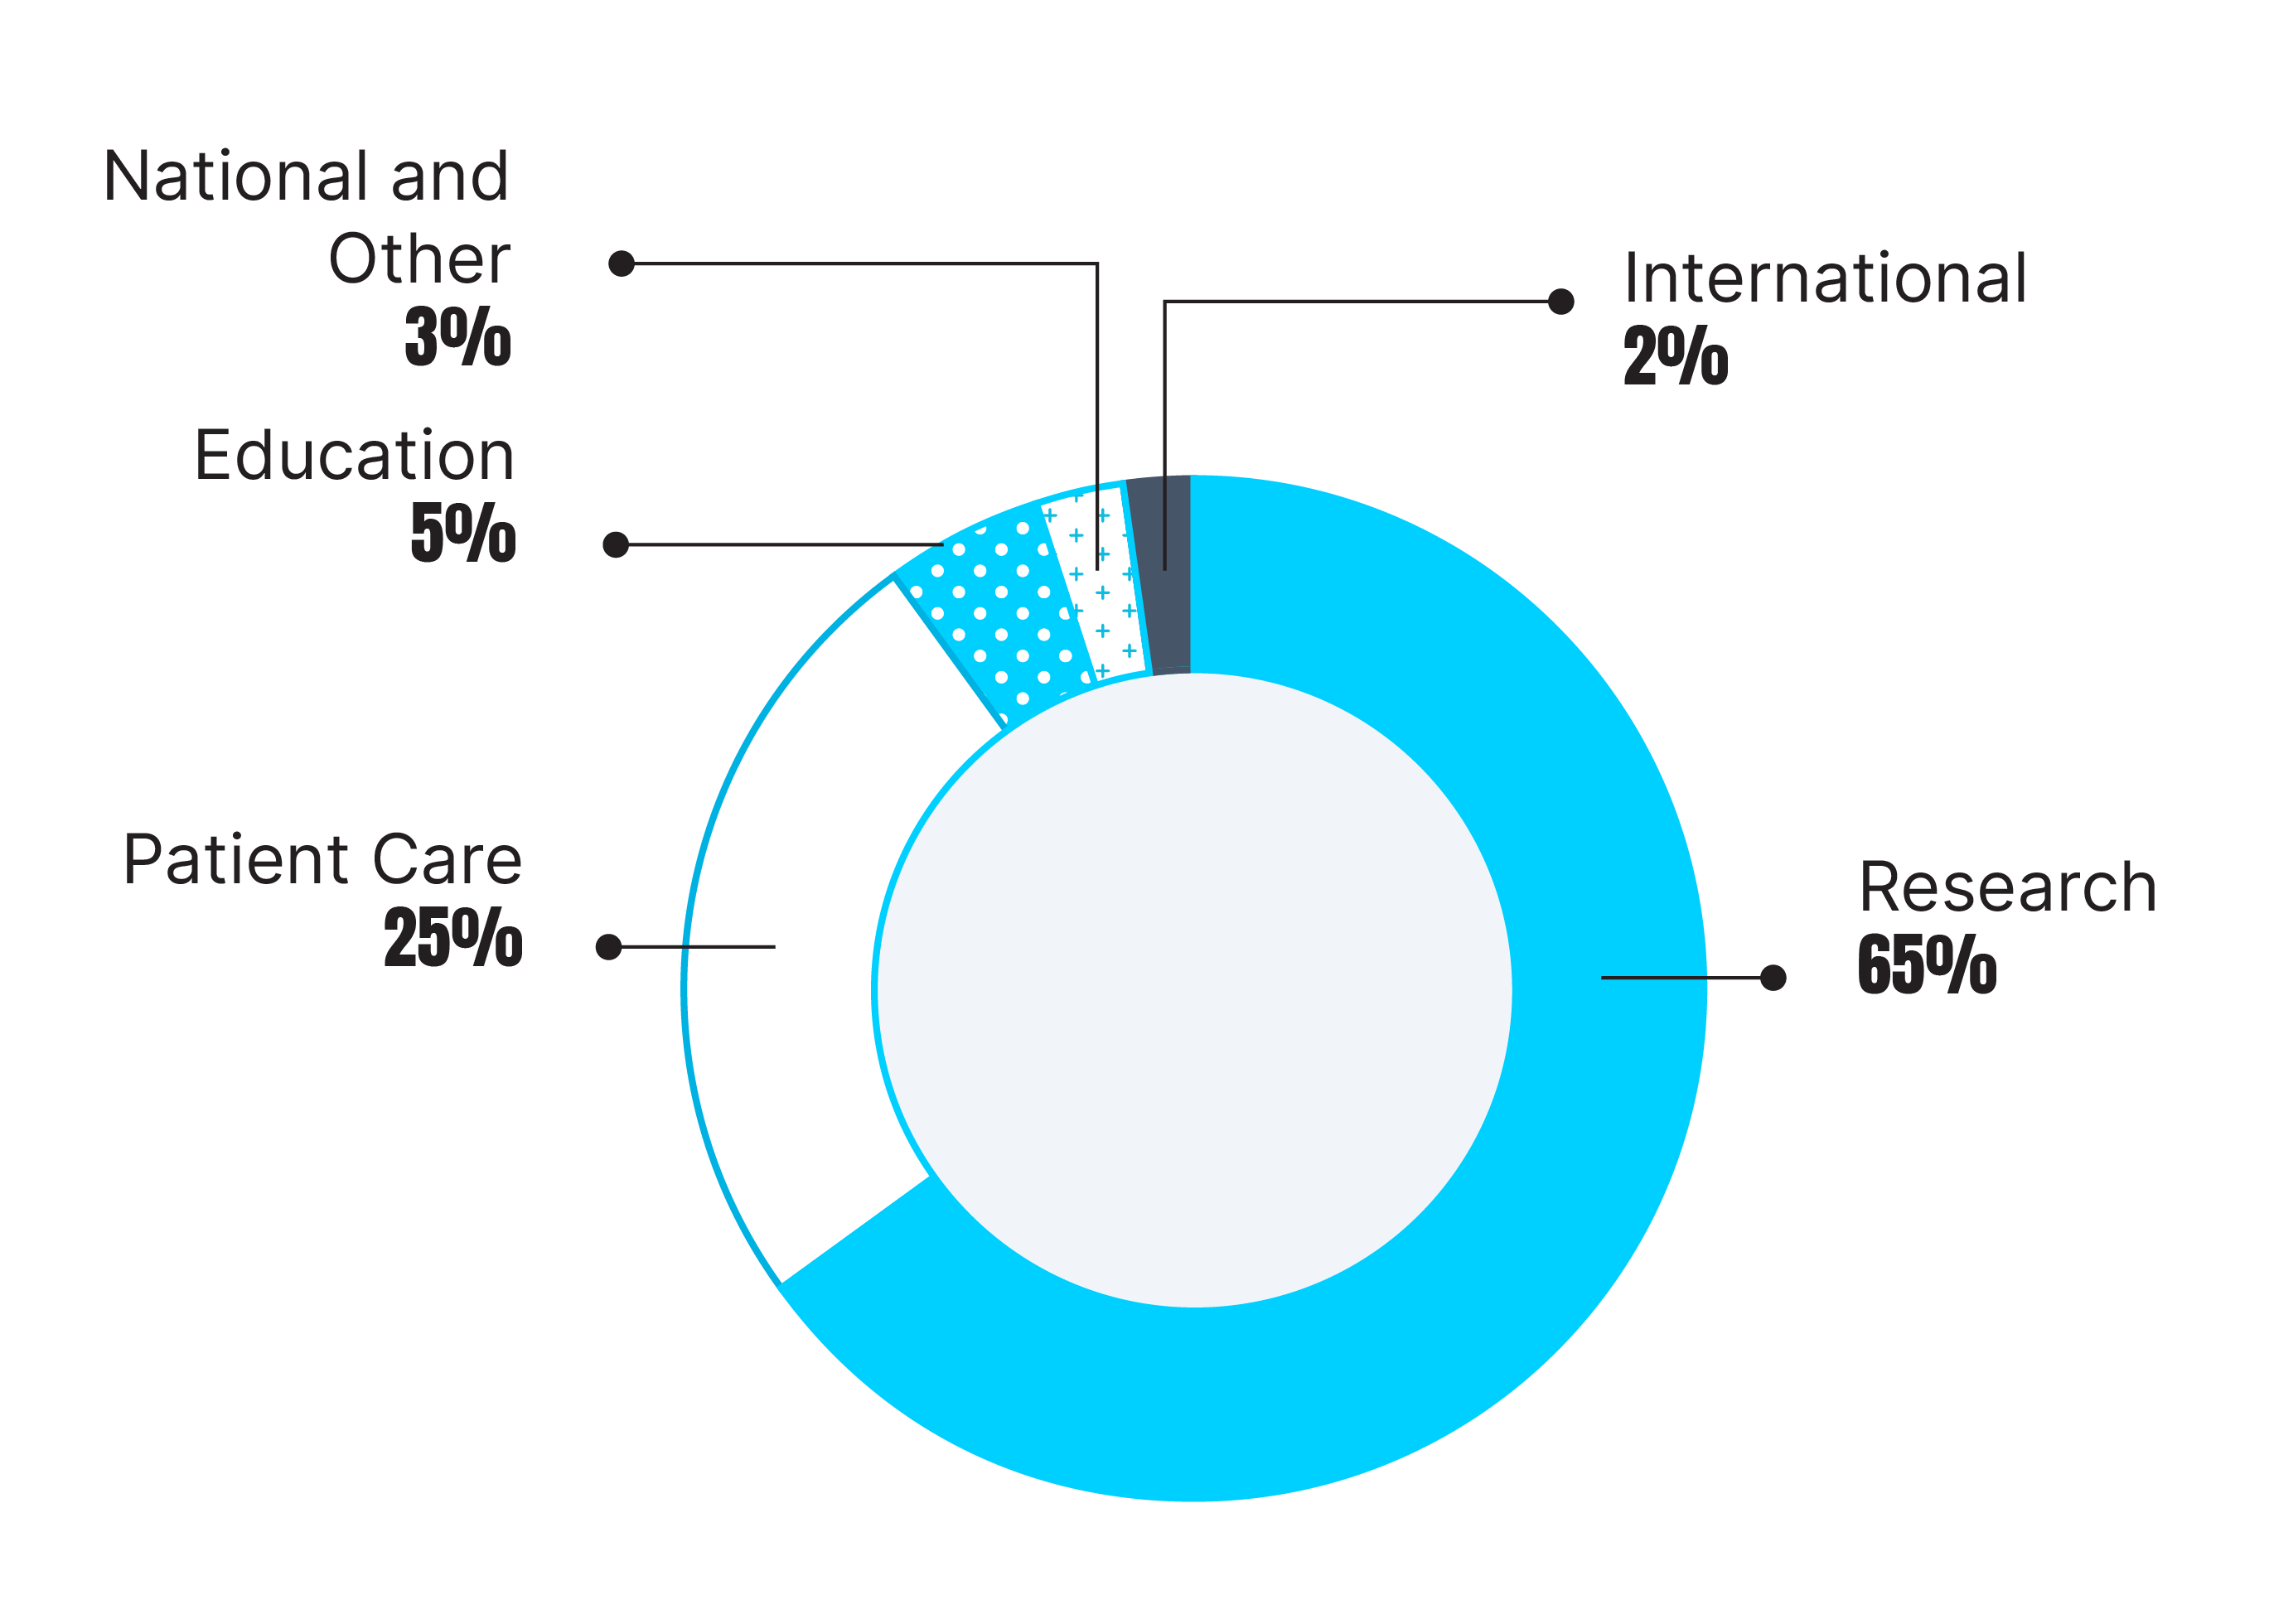
| Investments in Child Health Grants and Charitable Activity | Amount in Millions | Percentage |
|---|---|---|
| Research | $121 million | 65% |
| Patient Care | $47 million | 25% |
| Education | $10 million | 5% |
| International | $4 million | 2% |
| National and Other | $5 million | 3% |
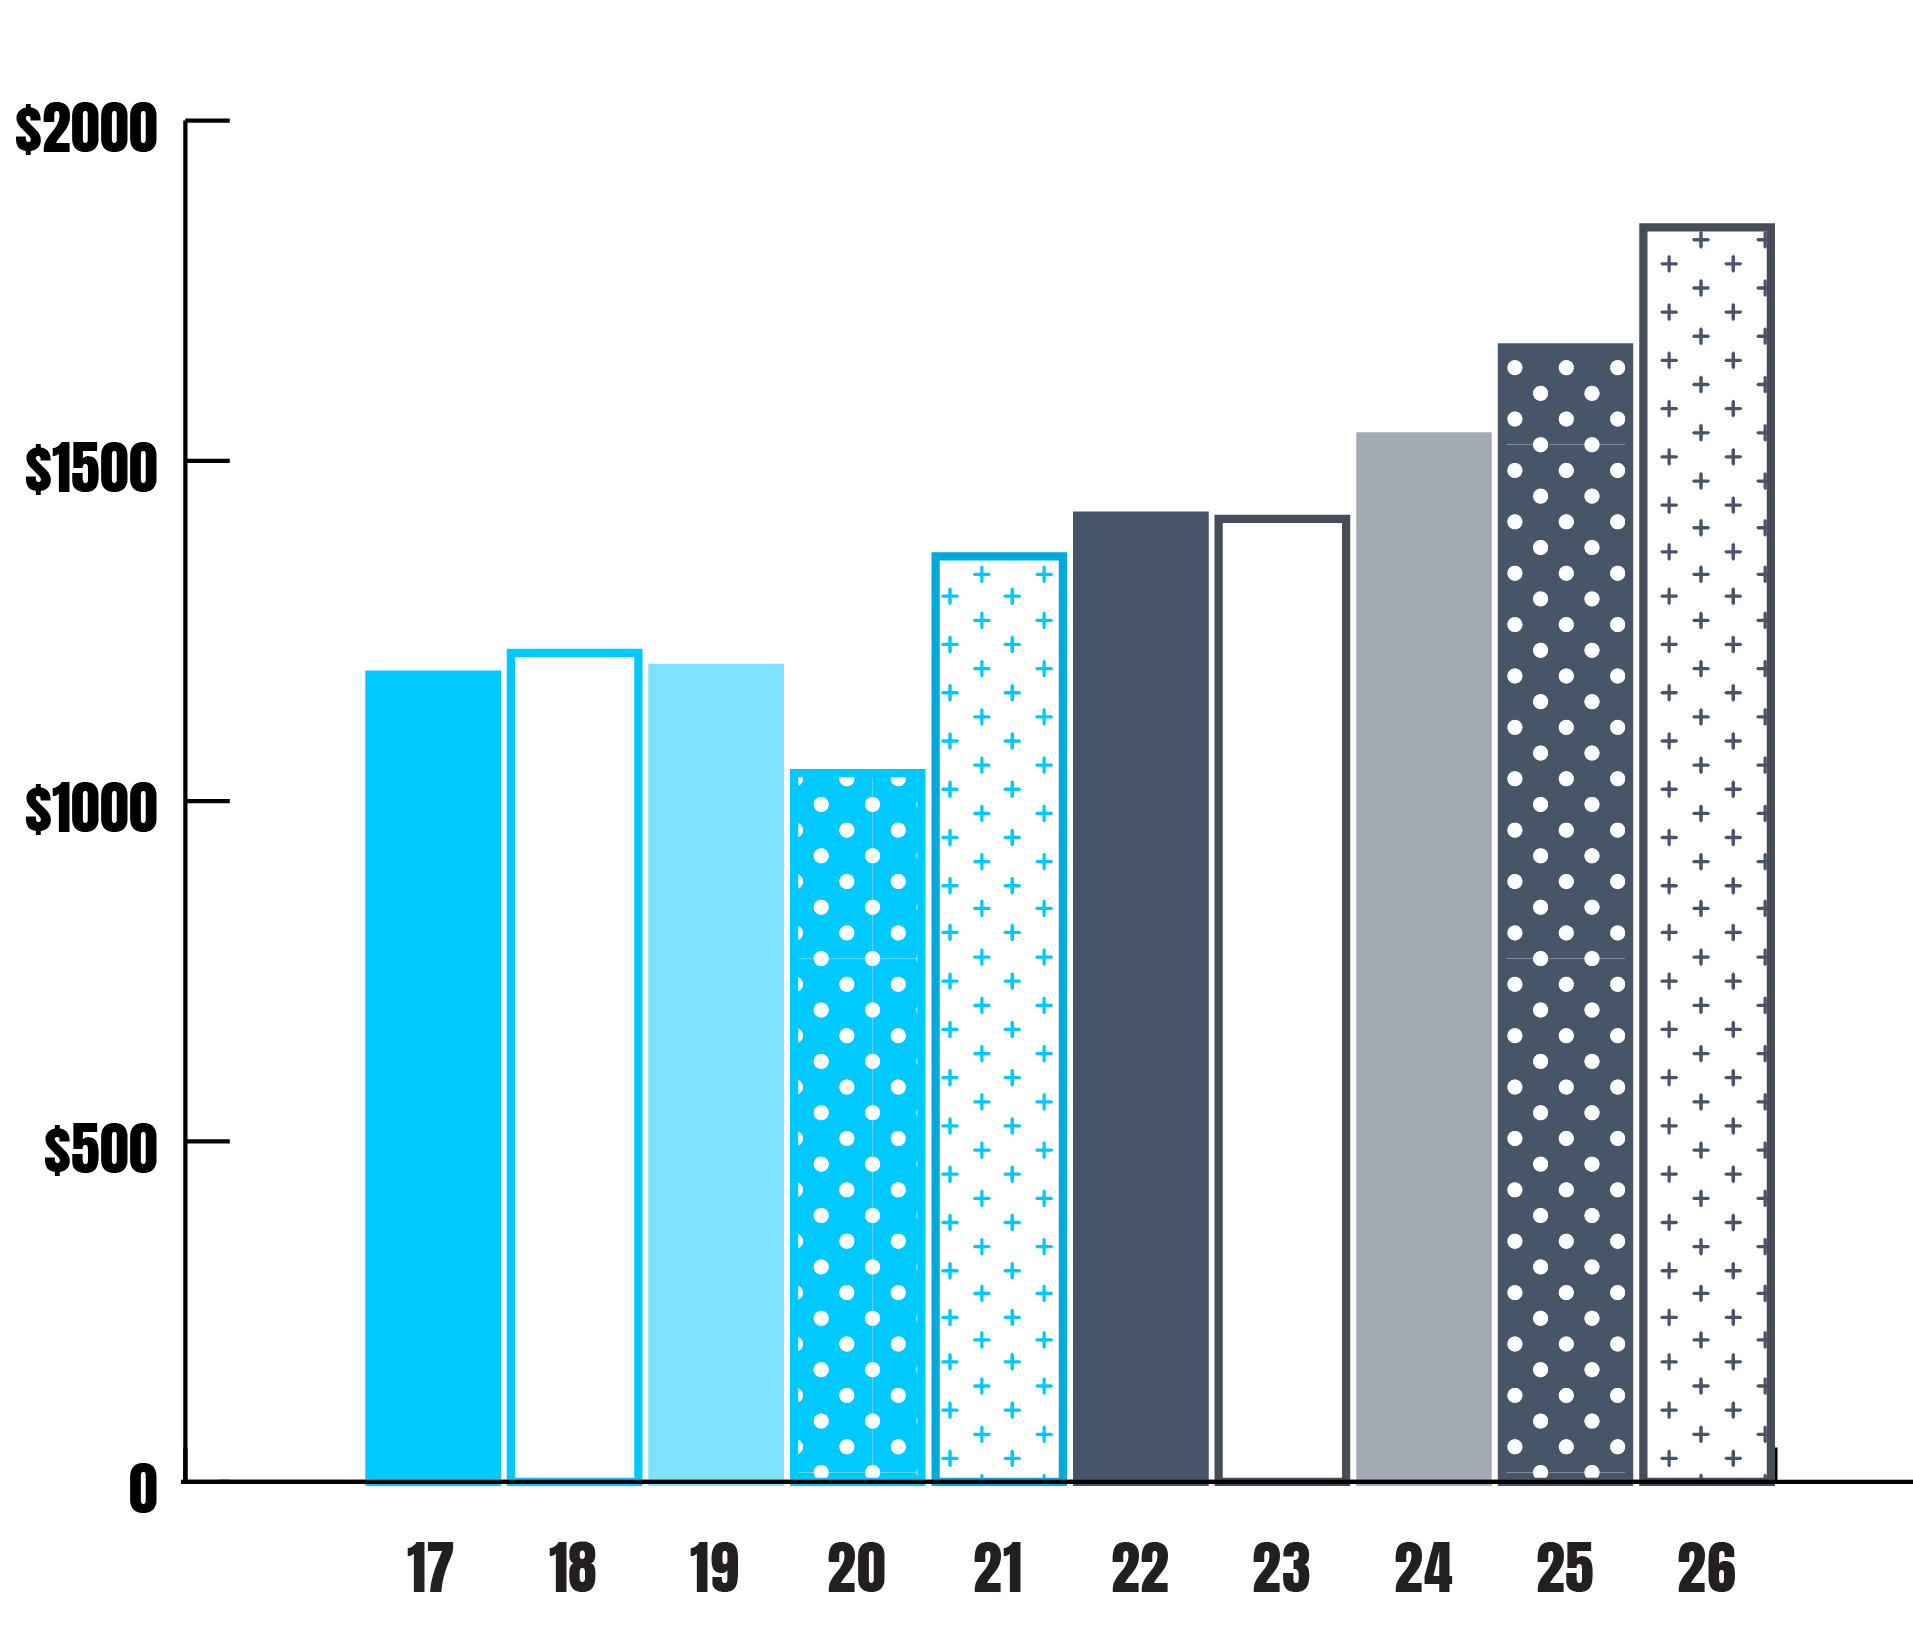
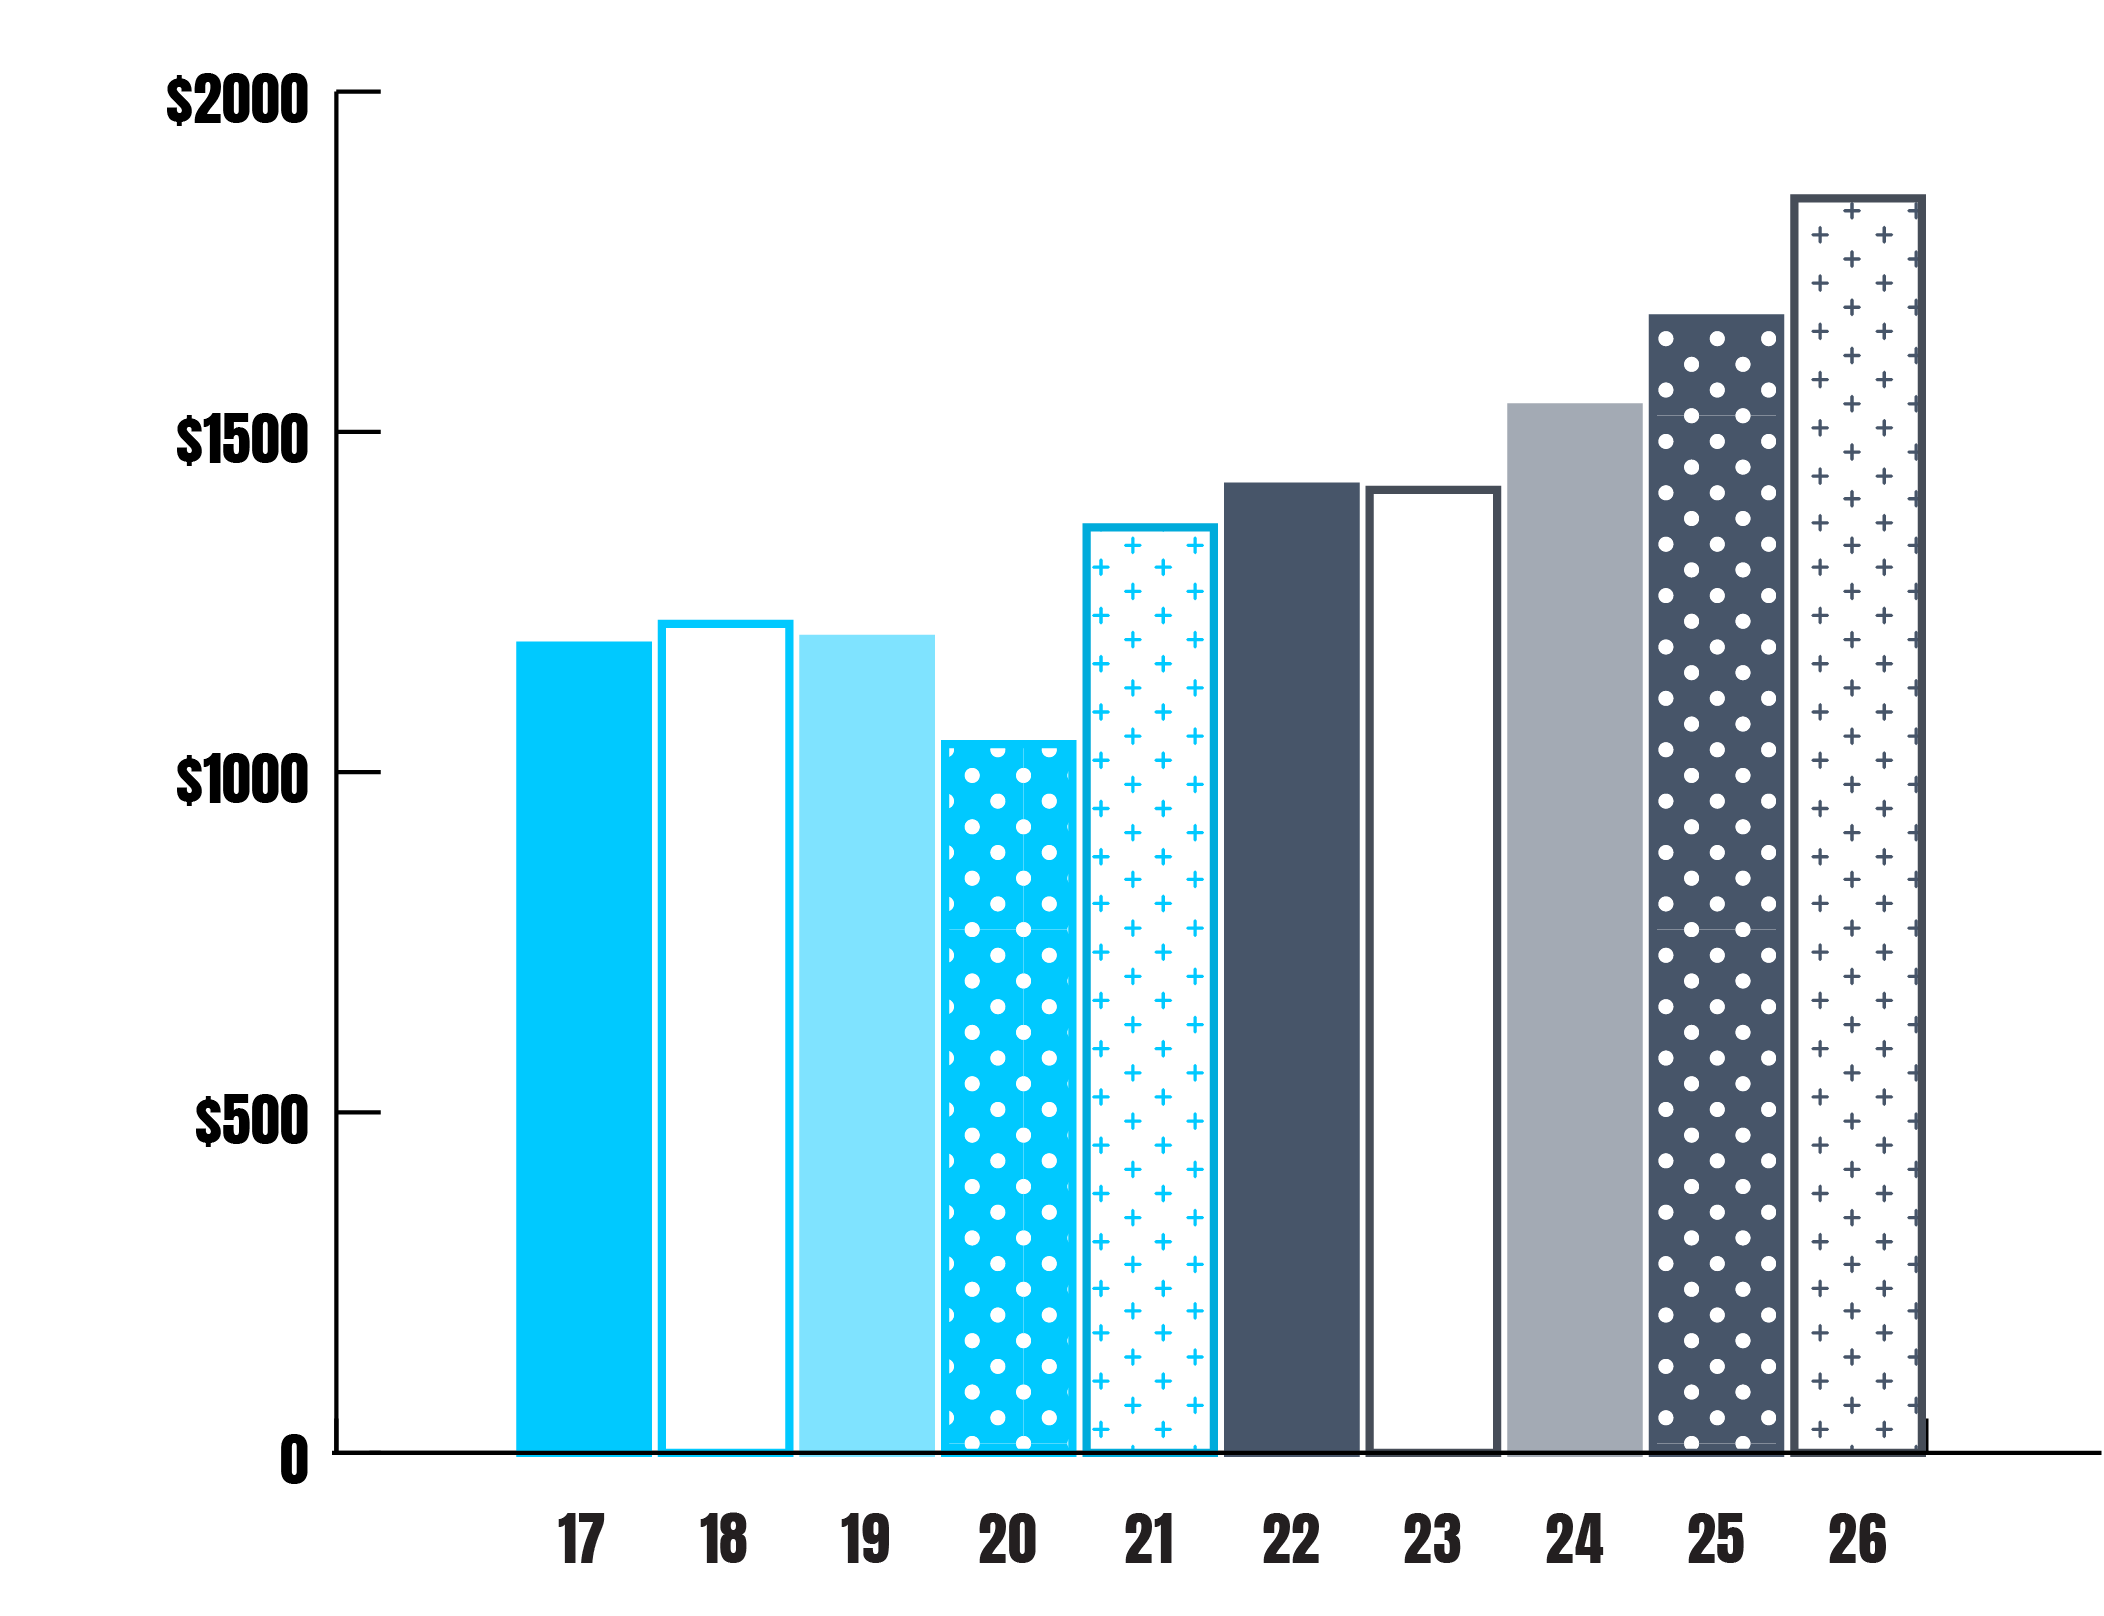
Total Assets
(in millions)
| Years | Total Assets in Millions |
|---|---|
| 2017 | $1,186 million |
| 2018 | $1,218 million |
| 2019 | $1,196 million |
| 2020 | $1,041 million |
| 2021 | $1,360 million |
| 2022 | $1,420 million |
| 2023 | $1,415 million |
| 2024 | $1,536 million |
| 2025 | $1,667 million |
| 2026 | $1,843 million |
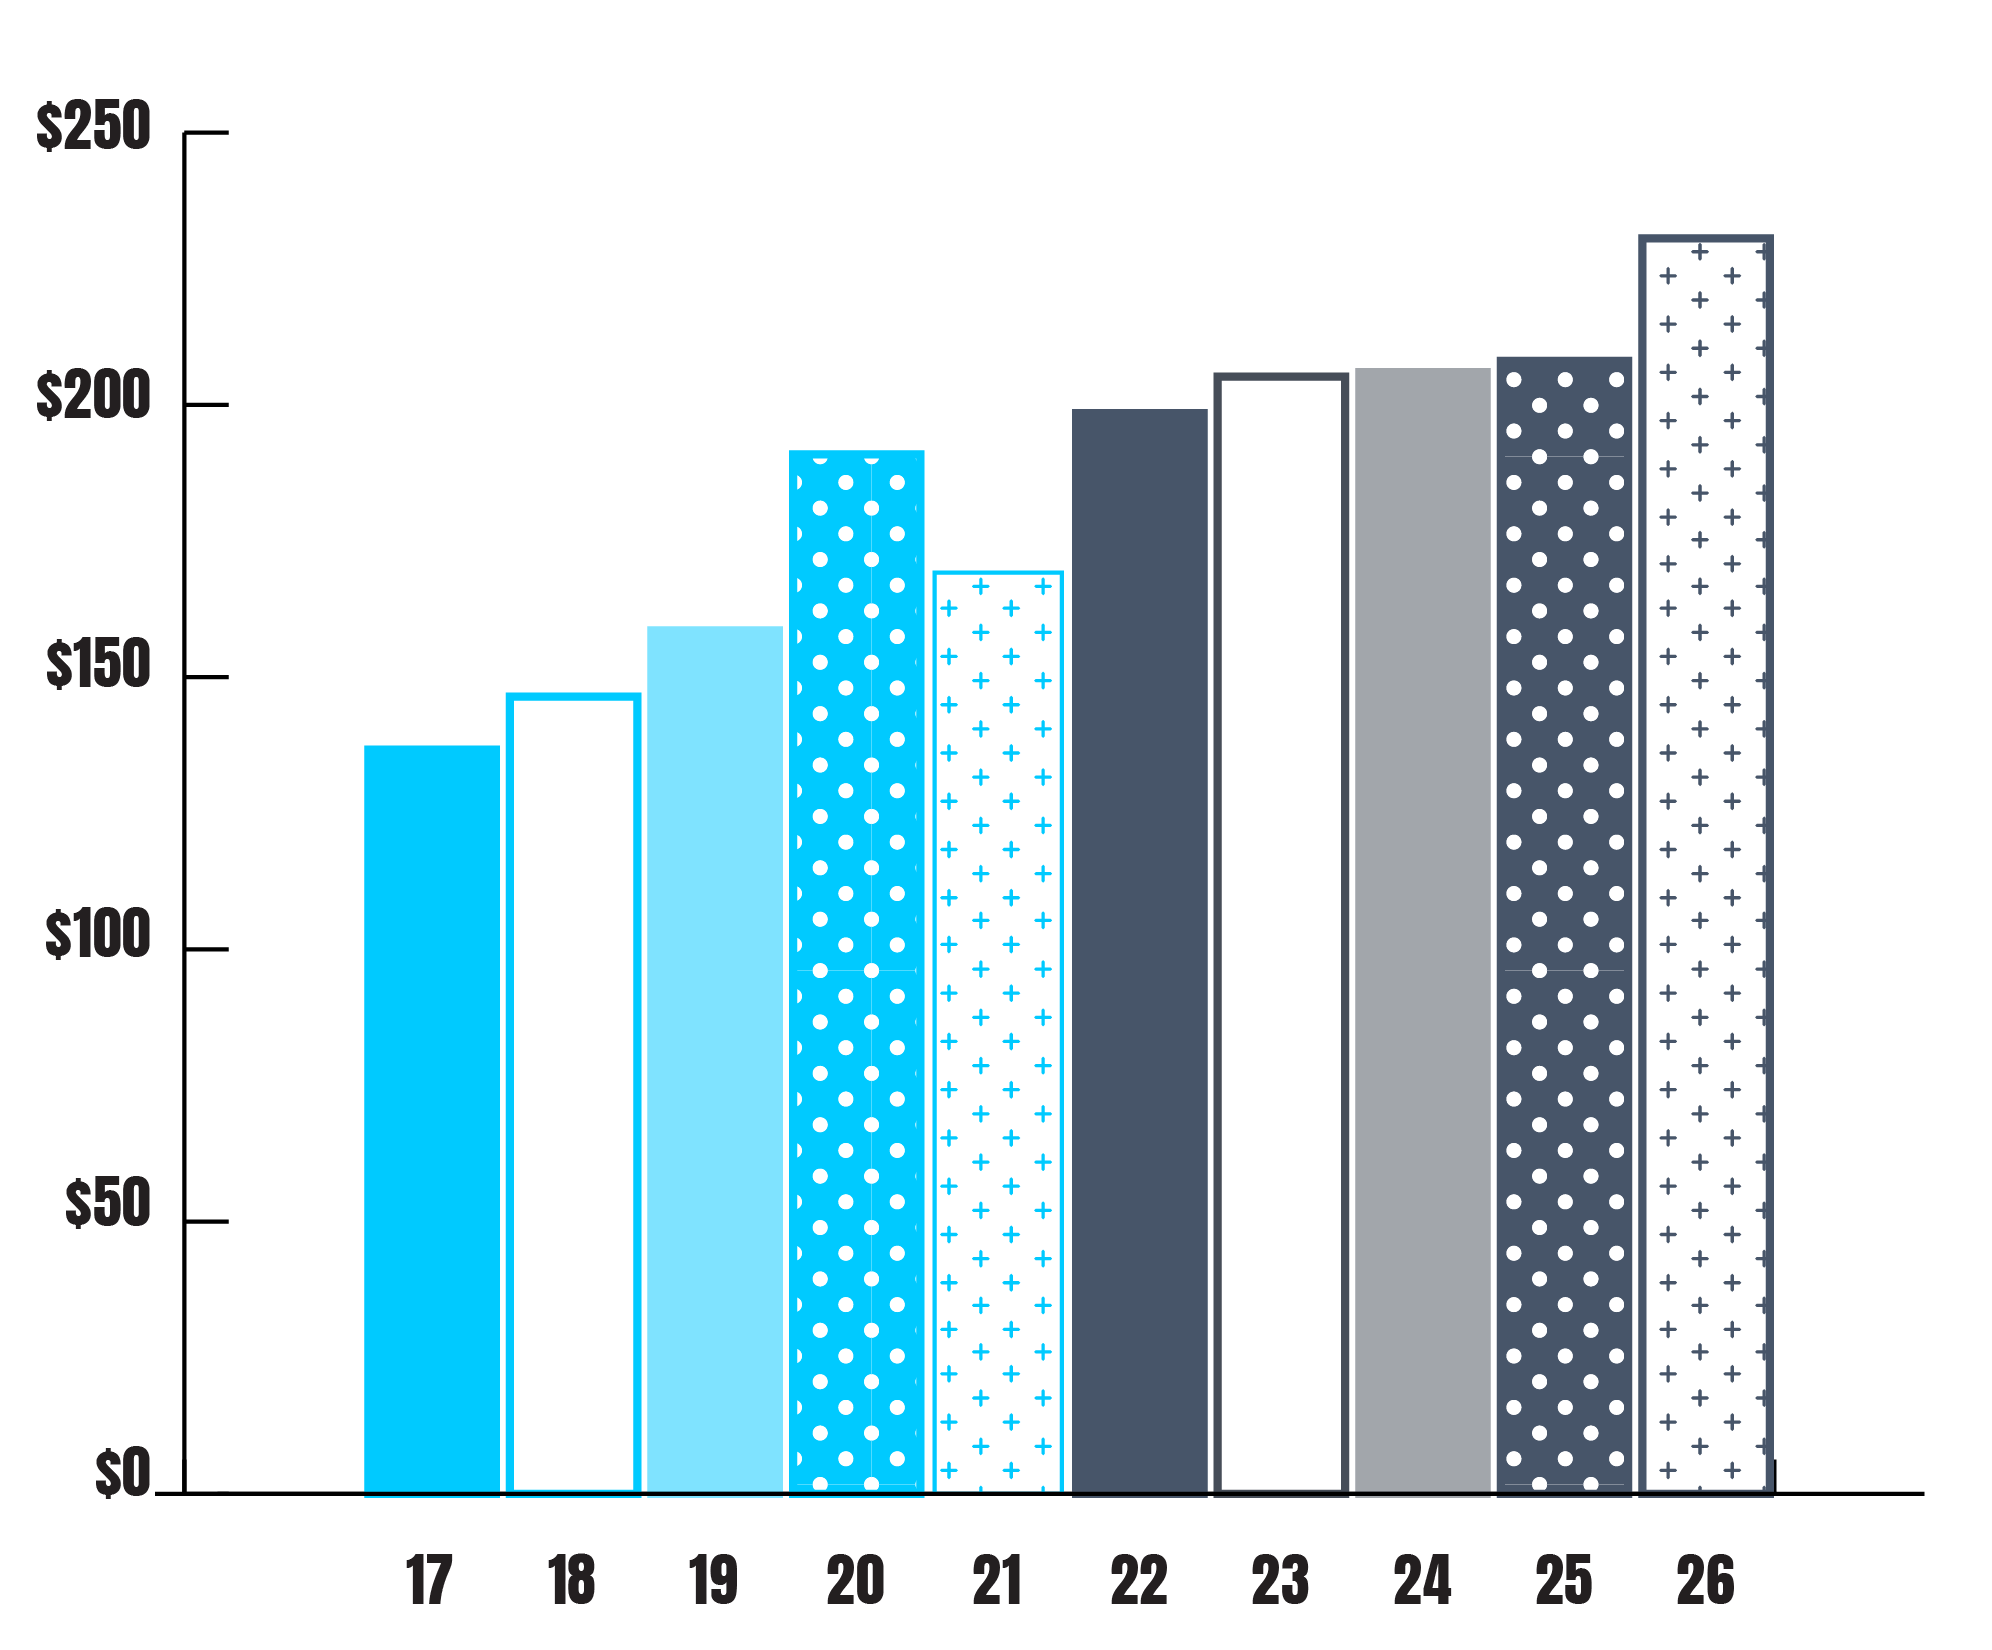
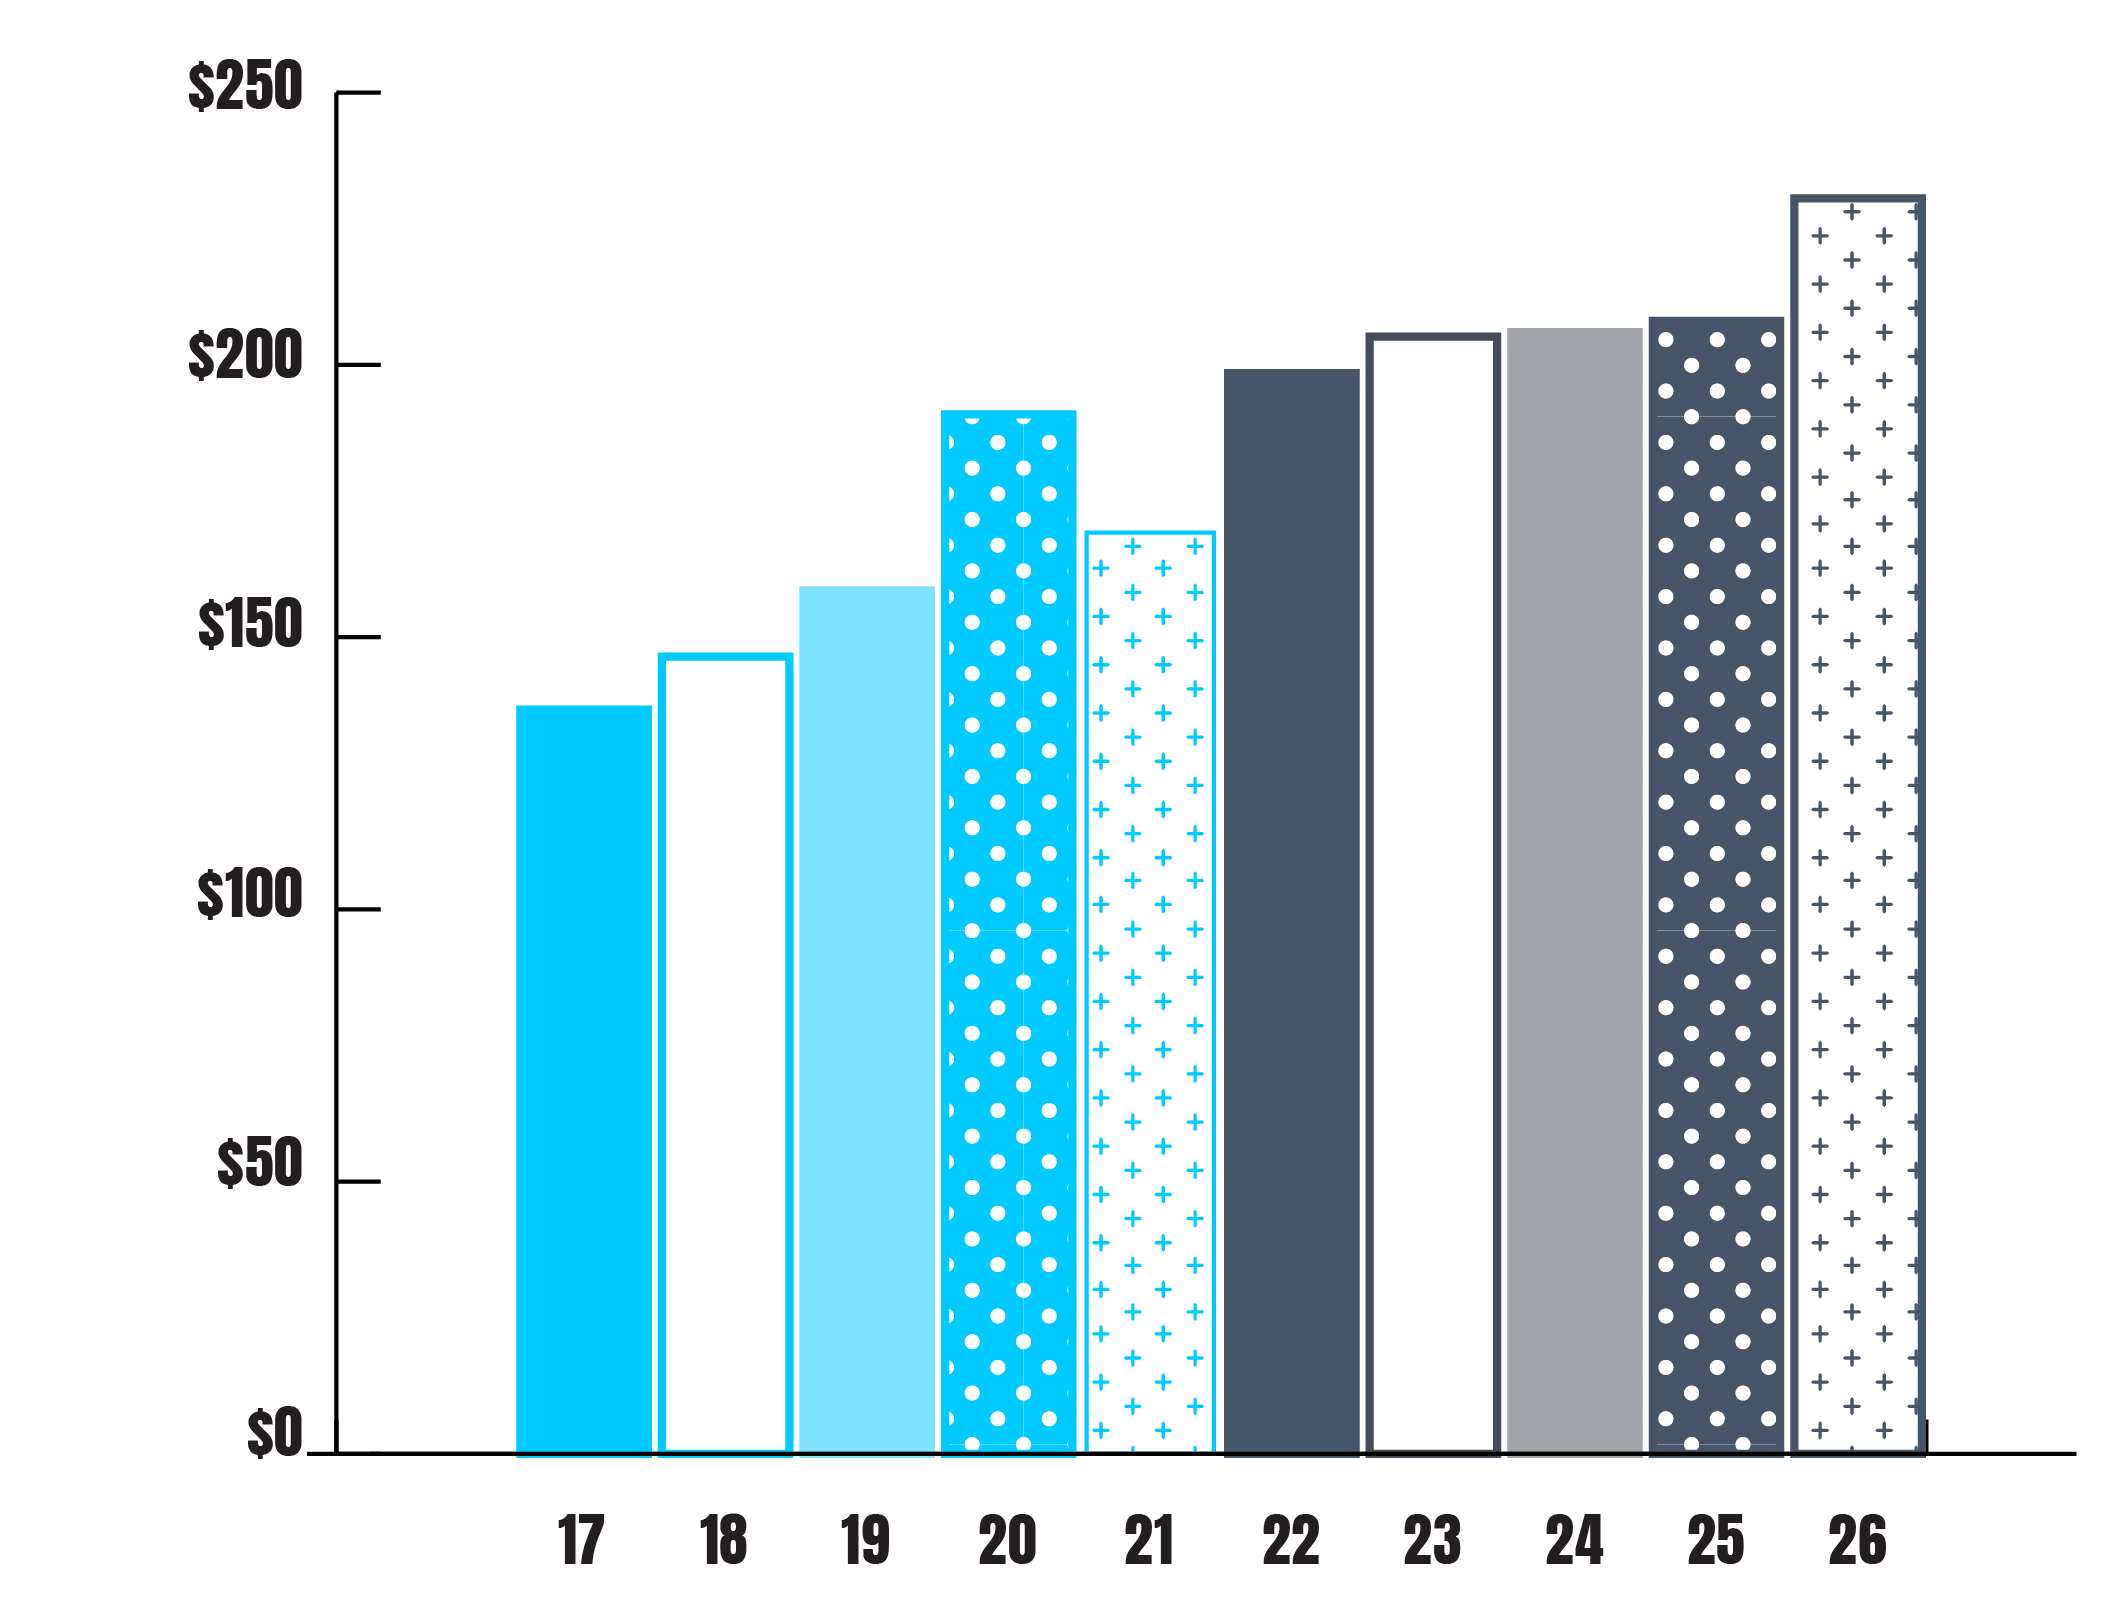
Fundraising revenue
(in millions)
| Years | Total Revenue in Millions |
|---|---|
| 2017 | $137 million |
| 2018 | $146 million |
| 2019 | $159 million |
| 2020 | $191 million |
| 2021 | $170 million |
| 2022 | $199 million |
| 2023 | $205 million |
| 2024 | $206 million |
| 2025 | $208 million |
| 2026 | $231 million |
Investment Management and Philosophy
Endowment funds at SickKids Foundation provide an important base of funding for child health initiatives. These funds consist of externally restricted and unrestricted contributions and internal resources, transferred by the Board of Directors, where the capital is required to be maintained intact over the long term. Each year, the Board approves the rate of payout, or distribution from the funds. The SickKids Foundation Board of Directors, through its Investment Committee, manages the Foundation’s endowed funds using a long-term, value-oriented investment philosophy.
The Committee believes that this philosophy best enables its objectives of preserving capital, enabling approved distribution (or payout), and realizing an average annual real total return after inflation of at least five per cent over a 10-year period. The Investment Committee regularly monitors the performance of the investment managers, selecting, appointing and releasing managers as required. The endowment fund continues to be among the top one per cent of performers when assessing returns since inception.
Investment Returns
Endowment Outpaces Inflation
(In millions)
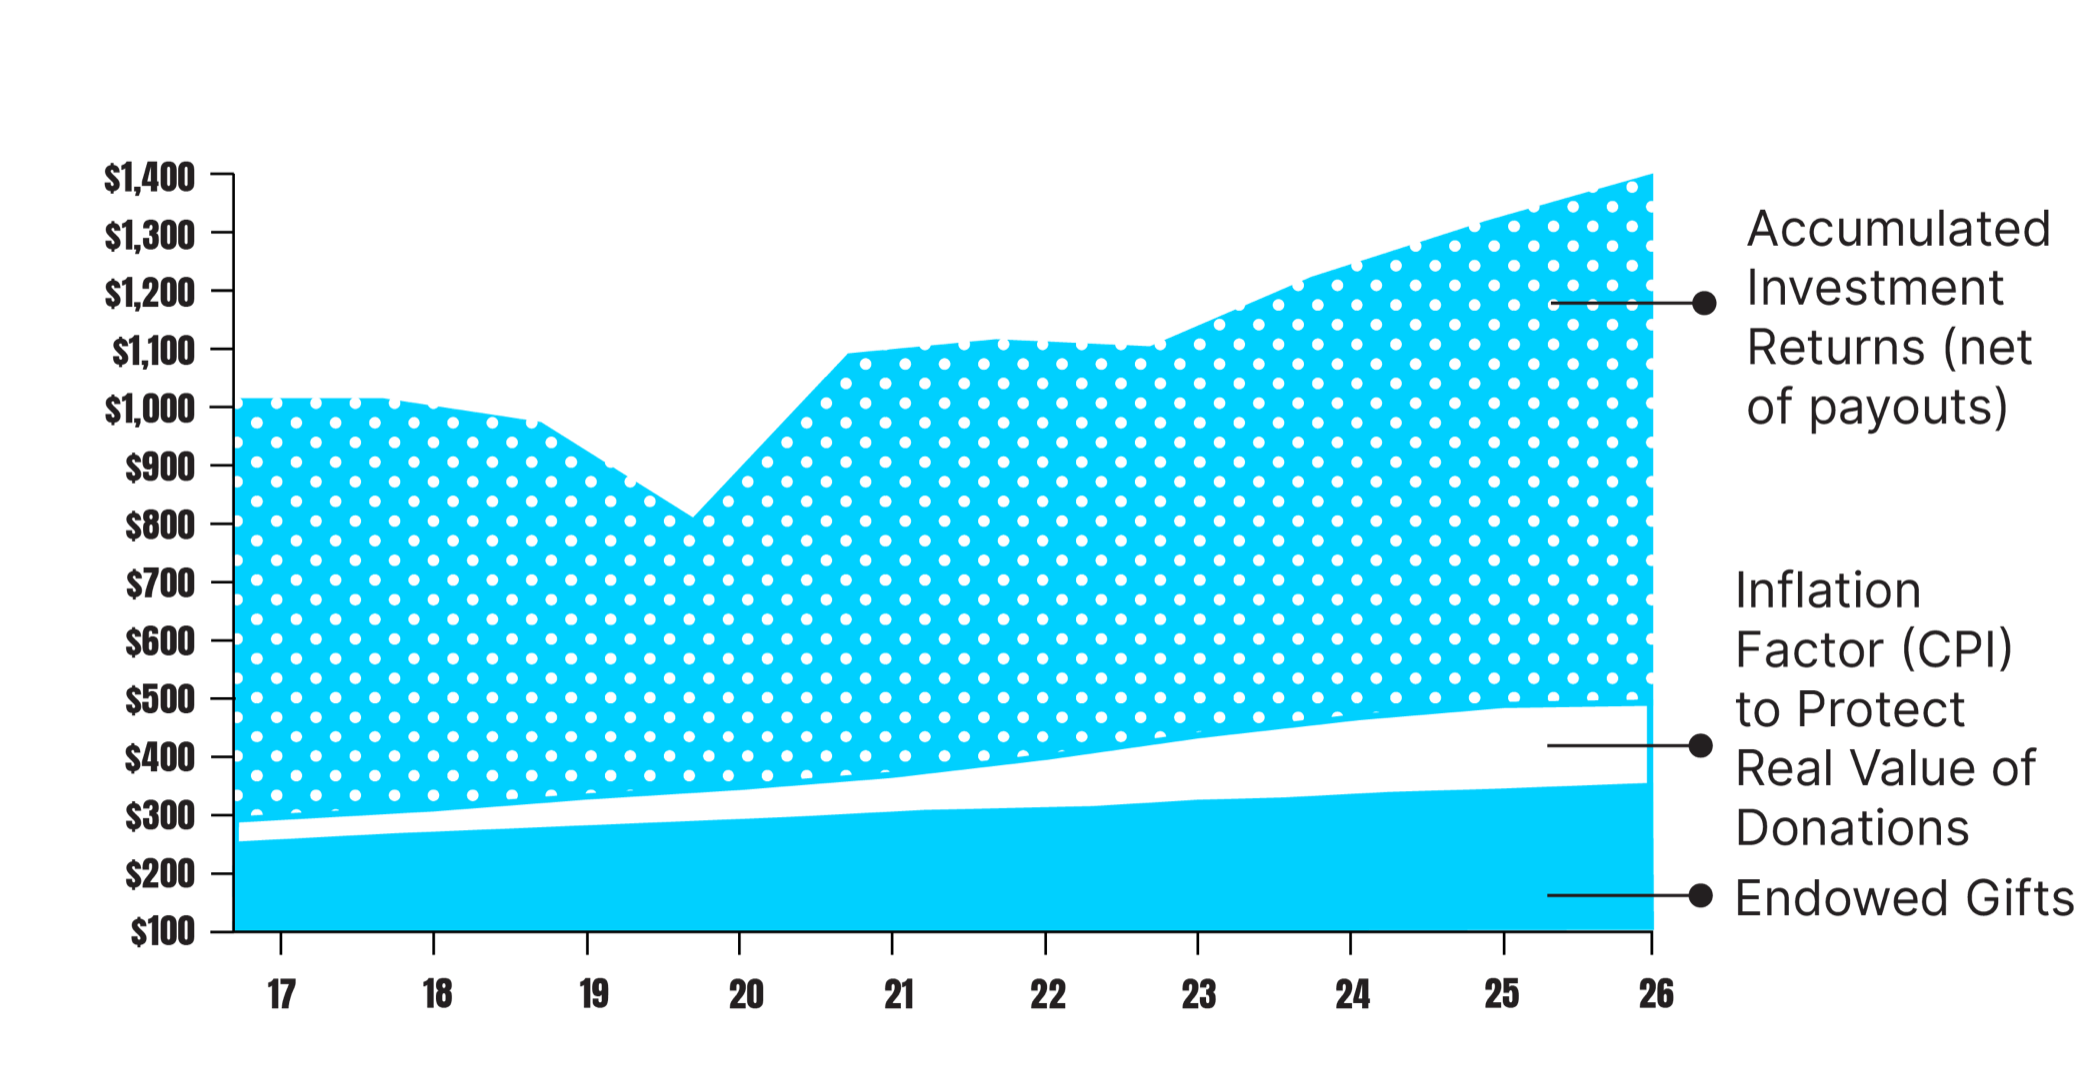
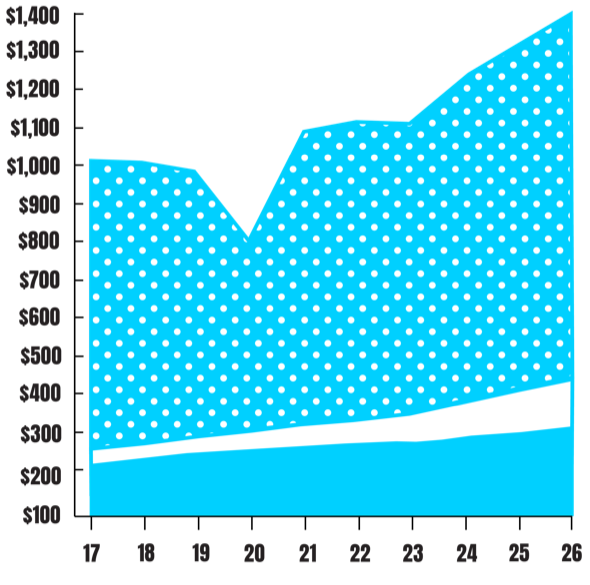
| Year | Total value of endowment fund | Rate of return for the year |
|---|---|---|
| 2017 | $1,013 million | 11.1% |
| 2018 | $1,006 million | 5.7% |
| 2019 | $982 million | 0.9% |
| 2020 | $807 million | negative 13.4% |
| 2021 | $1,090 million | 28.5% |
| 2022 | $1,113 million | 3.2% |
| 2023 | $1,109 million | 2.1% |
| 2024 | $1,218 million | 10.5% |
| 2025 | $1,298 million | 9.6% |
| 2026 | $1,398 million | 9.7% |
- Accumulated investment returns (net of payouts)
- Inflation factor (CPI) to protect real value of donations
- Endowed gifts
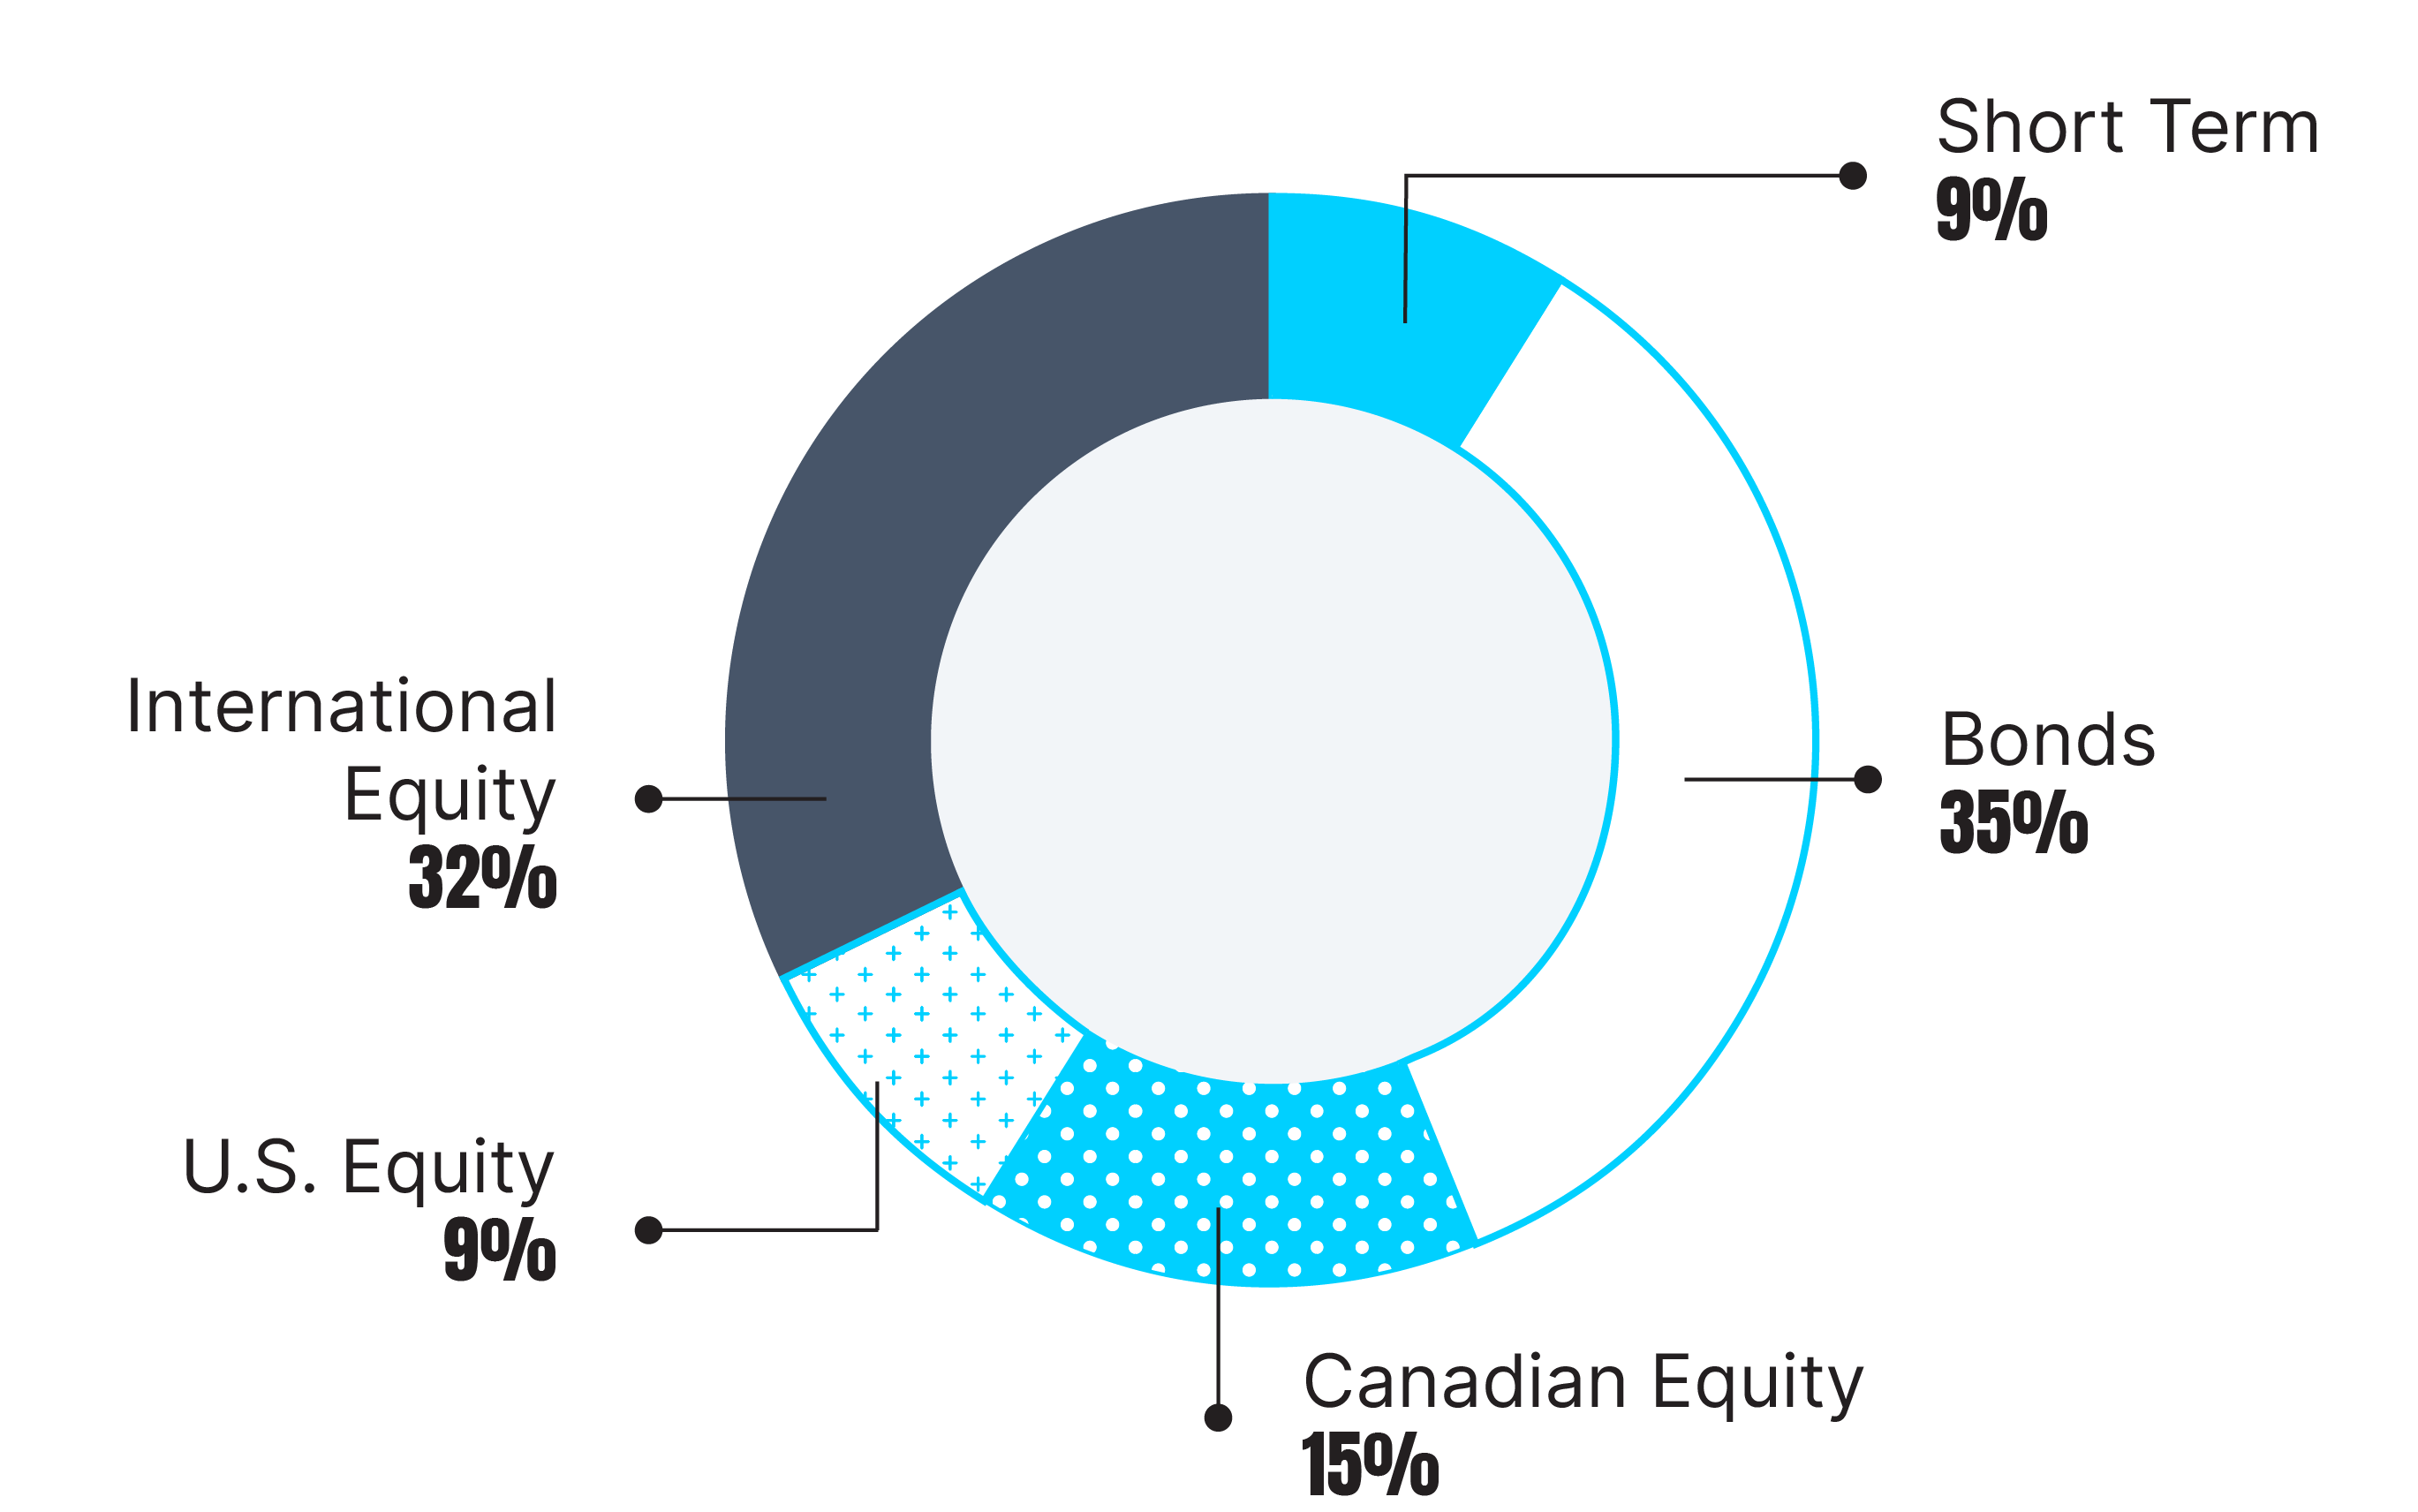
Investment Asset Mix
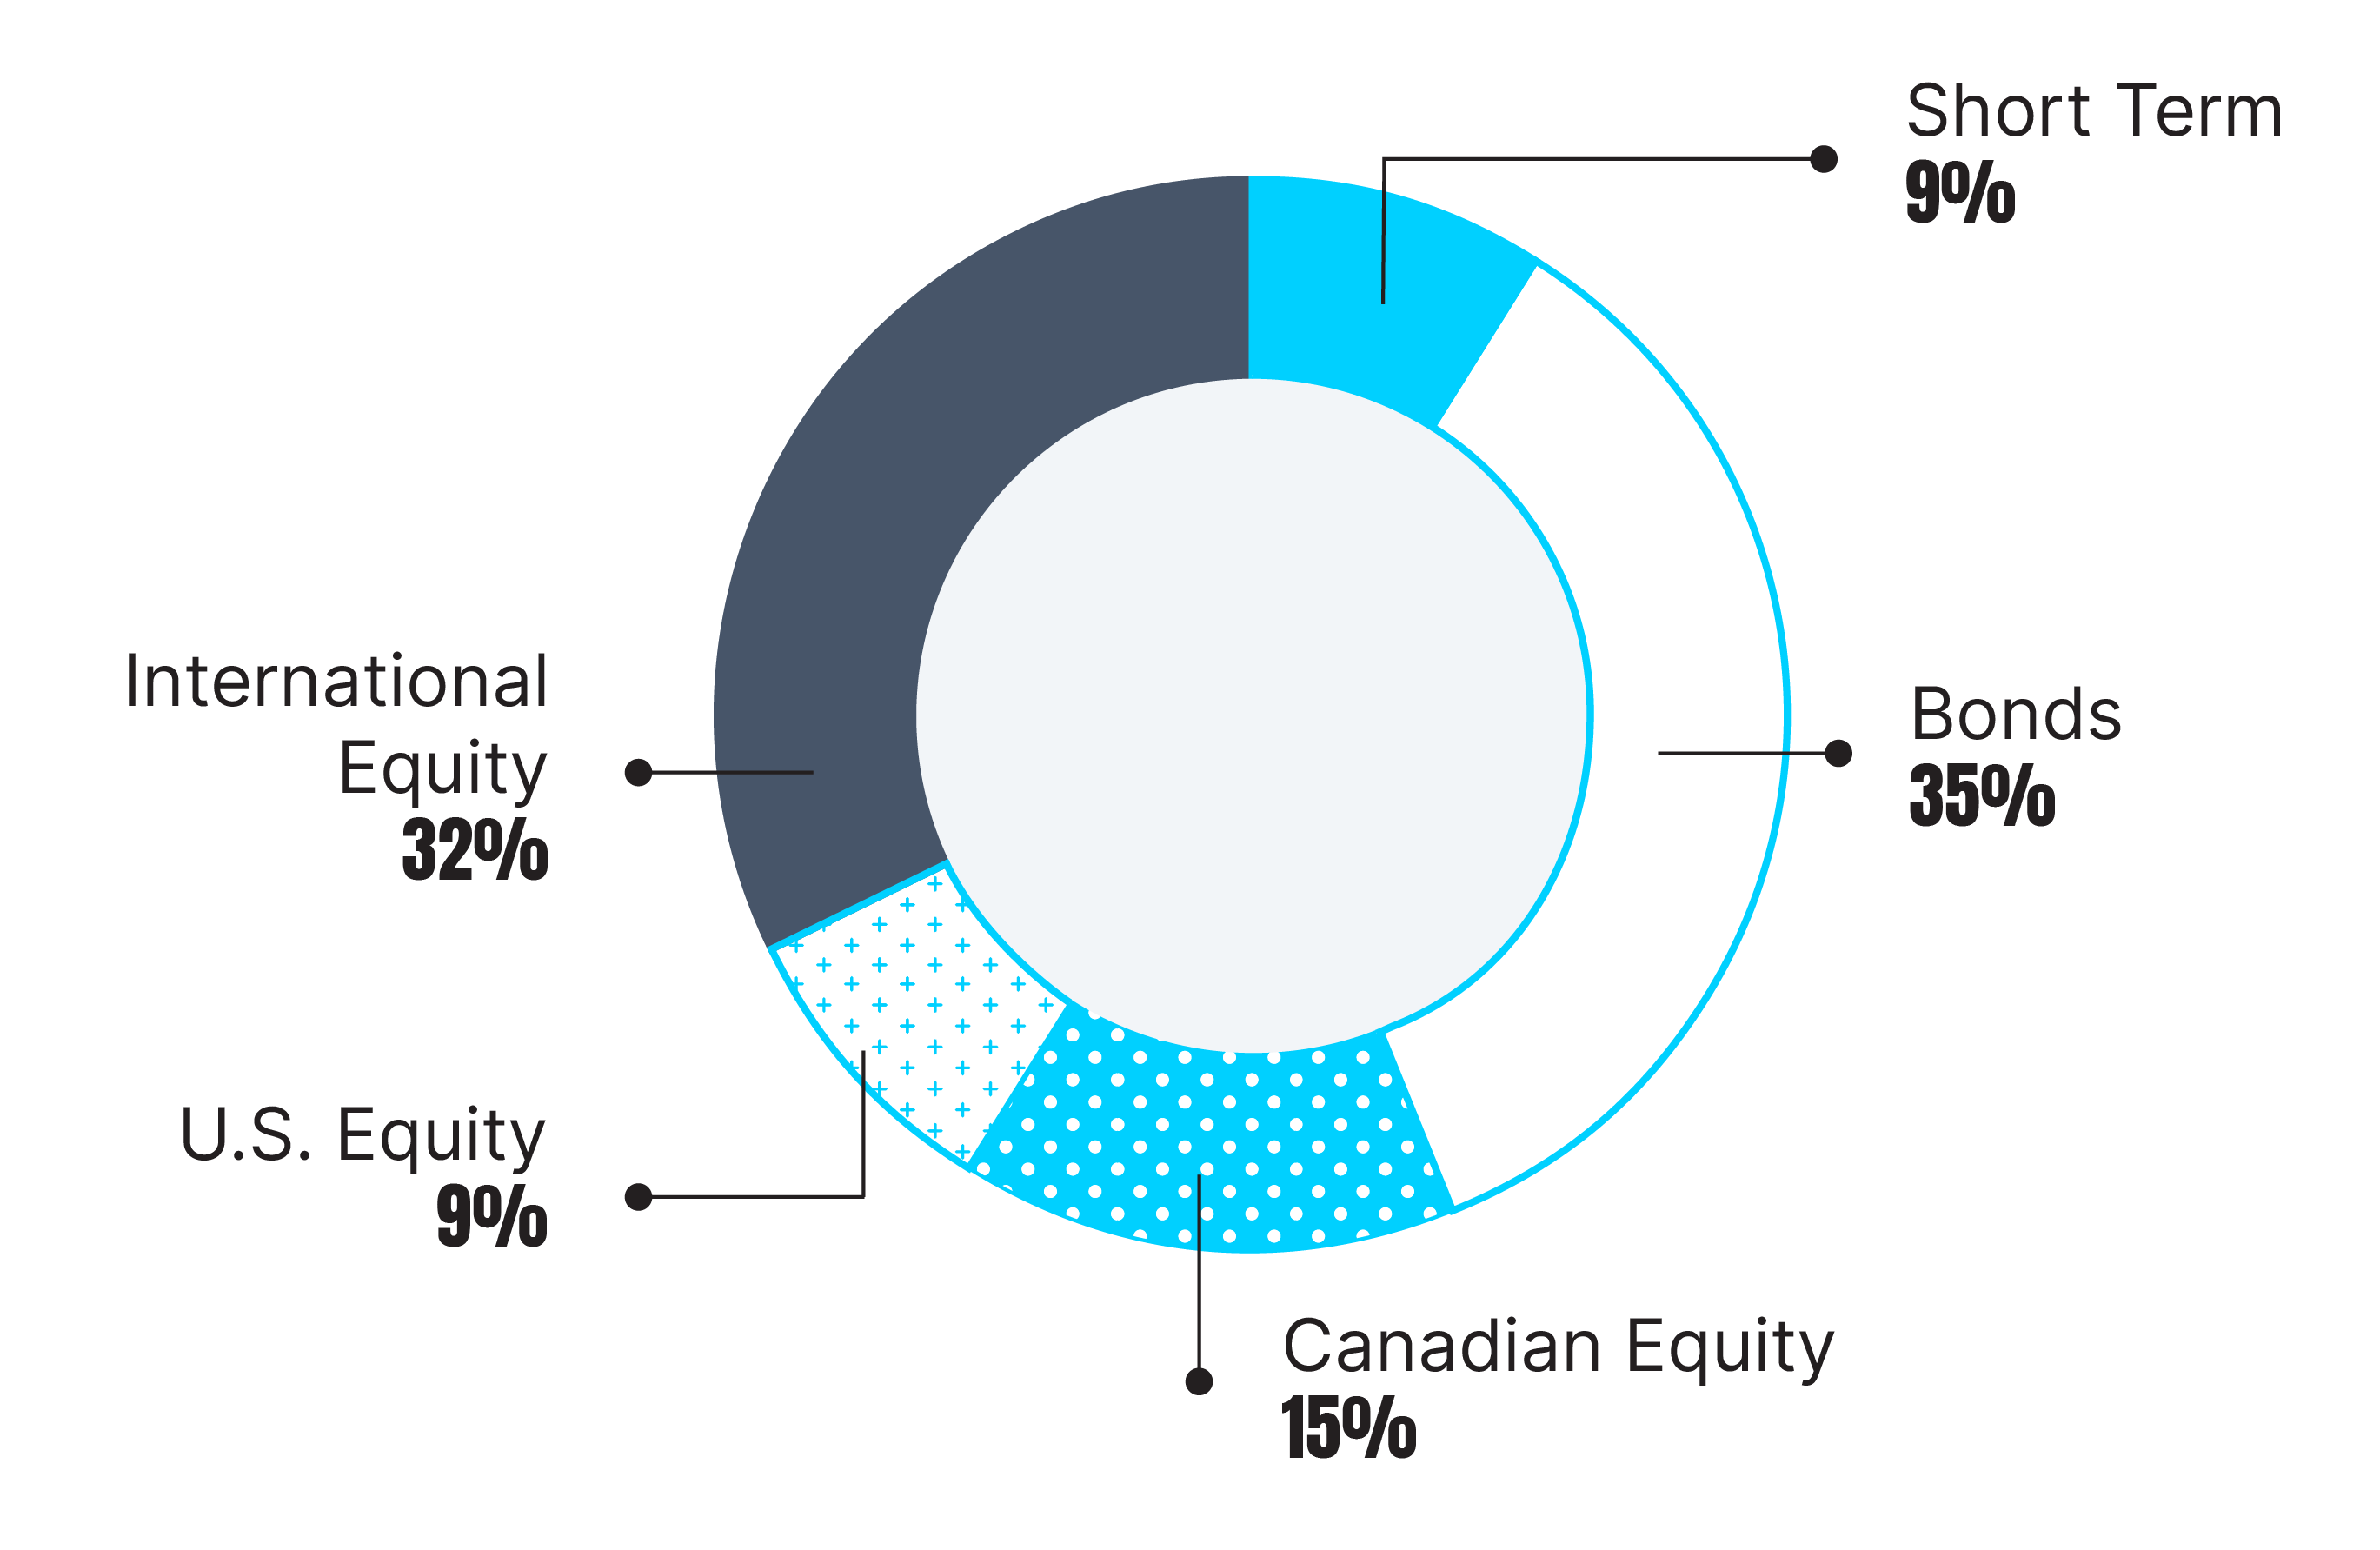
| Investment Asset | Percentage |
|---|---|
| Short Term | 9% |
| Bonds | 35% |
| Canadian Equity | 15% |
| U.S. Equity | 9% |
| International Equity | 32% |