Hospital
Financials
SickKids is committed to operational efficiency, transparency and accountability. We support evidence-based decisions to enhance our financial health, conduct business under the principle of fiscal prudence and act with integrity and good judgment when allocating resources.
For 2023-2024 the Hospital had an operating deficit of ($1.9M). Included in the deficit was $15.1M in restricted investment income (not available for operations) for the Hospital's debenture retirement funds, its supplemental pension plan and donor restricted funds. After adjusting for this restricted investment income to better understand the true state of the Hospital's operations and funding levels, we note that the Hospital continues to be challenged by a significant structural deficit, as reported in previous years.
The structural deficit relates to many years where the rate of inflation, progressive increases in patient acuity and other cost pressures are outpacing rate of funding growth from our major funder, the Ministry of Health/Ontario Health. The Hospital continues to work with the Ministry of Health and Ontario Health to review funding levels and the funding model for specialized paediatric care.
| Sources of Revenue | Amount (In millions) | Percentage |
|---|---|---|
| Amortization | $38.1 | 3% |
| Commercial Ventures | $50.0 million | 4% |
| Patient Care and Other | $68.5 | 5% |
| SickKids Foundation | $127.4 | 9% |
| Research Grants | $171.2 | 13% |
| Investment Income | $28.4 | 2% |
| Ministry of Health/Ontario Health | $866.0 | 64% |
| Total | $1.35 Billion |
| Sources of Souces of Expenses | Amount (In millions) | Percentage |
|---|---|---|
| Administrative and General | $37.4 | 3% |
| Depreciation and Accretion | $78.3 | 6% |
| Other Operating Expenses | $152.2 | 11% |
| Clinical Supplies and Drugs | $205.3 | 15% |
| Interest | $22.1 | 2% |
| Compensation | $856.0 | 63% |
| Total | $1.35 Billion |
| Revenues (In Millions) | Amount (In millions) | Percentage |
|---|---|---|
| Fee-for-Service | $44.8 | 5% |
| Other | $58.7 | 6% |
| Ministry of Health | $808.4 | 89% |
| Total | $911.9 Million |
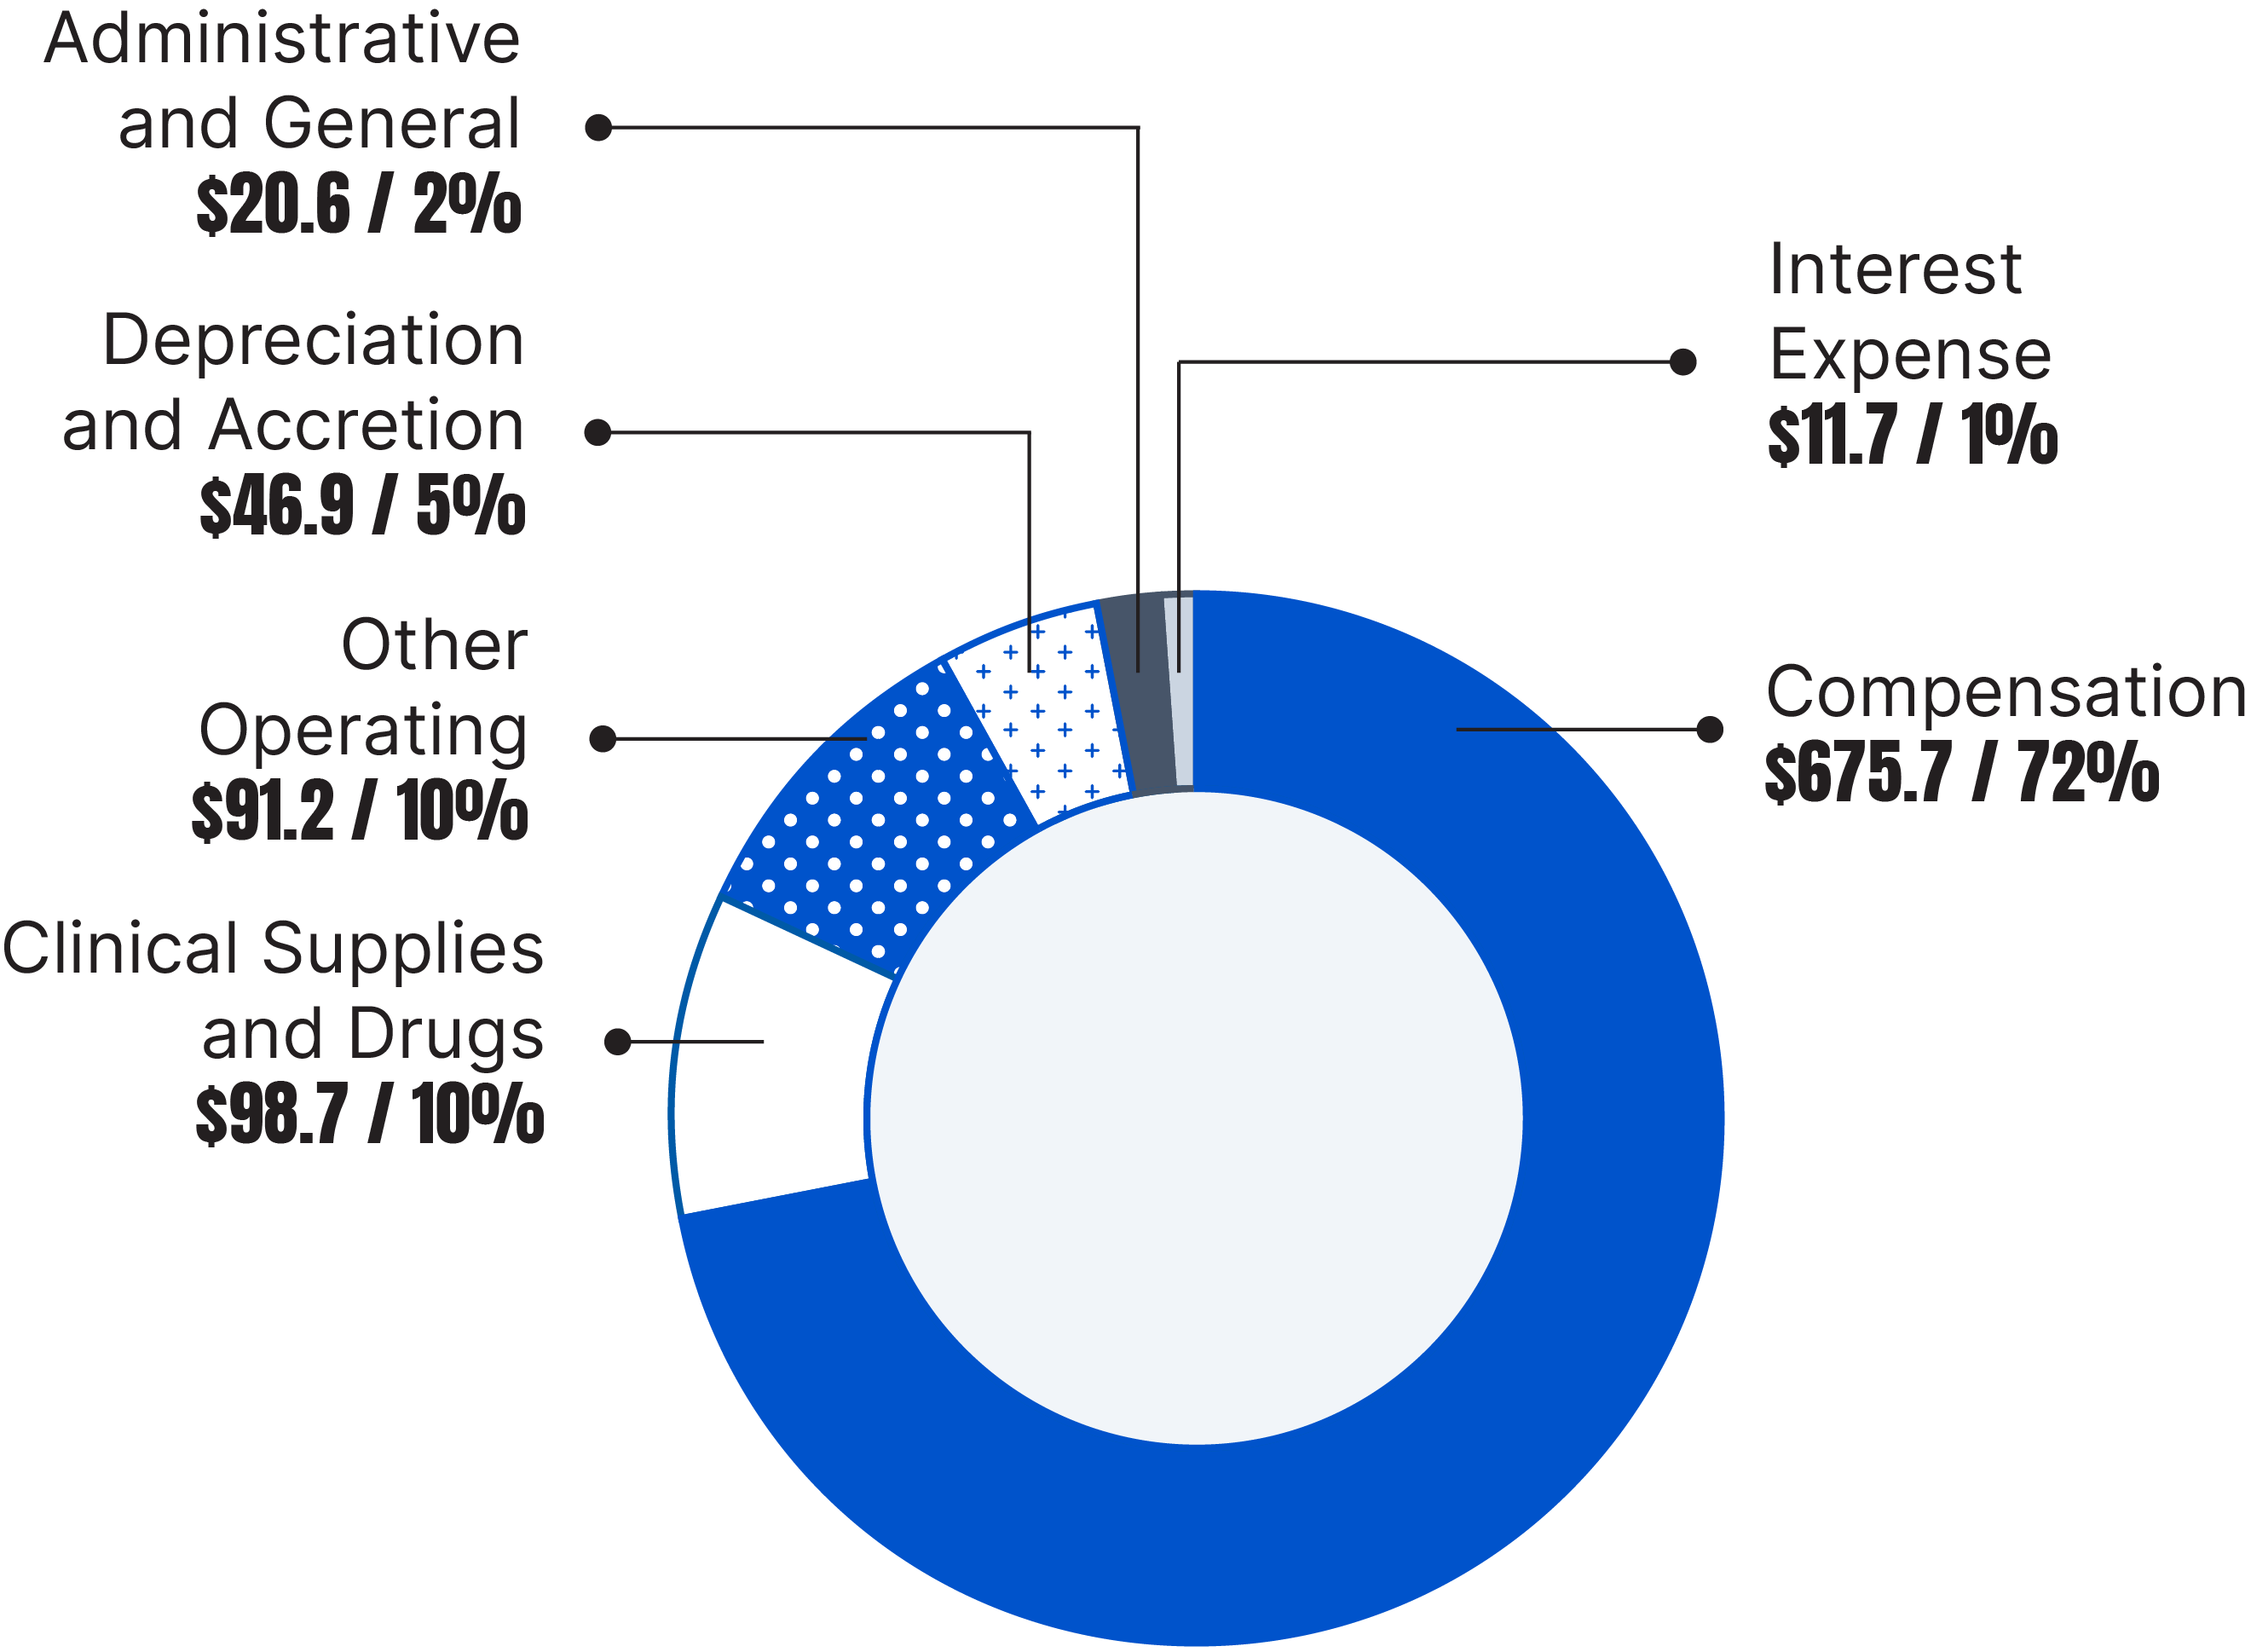
| Expenses (In Millions) | Amount (In millions) | Percentage |
|---|---|---|
| Administrative and General | $21.1 | 3% |
| Depreciation and Accretion | $46.9 | 6% |
| Other Operating | $69.1 | 9% |
| Supplies and Drugs | $82.7 | 10% |
| Interest Expense | $10.3 | 1% |
| Compensation | $566.9 | 71% |
| Total | $944.8 Million |
| Hospital Investments (In Millions) | Amount (In millions) | Percentage |
|---|---|---|
| Other | $29.9 | 7% |
| Patient Support Centre Unused Debenture Proceeds | $60.6 | 15% |
| Debenture Retirement Sinking Funds | $88.7 | 21% |
| Post Retirement Benefit Assets | $238.8 | 57% |
| Total | $418.0 Million |
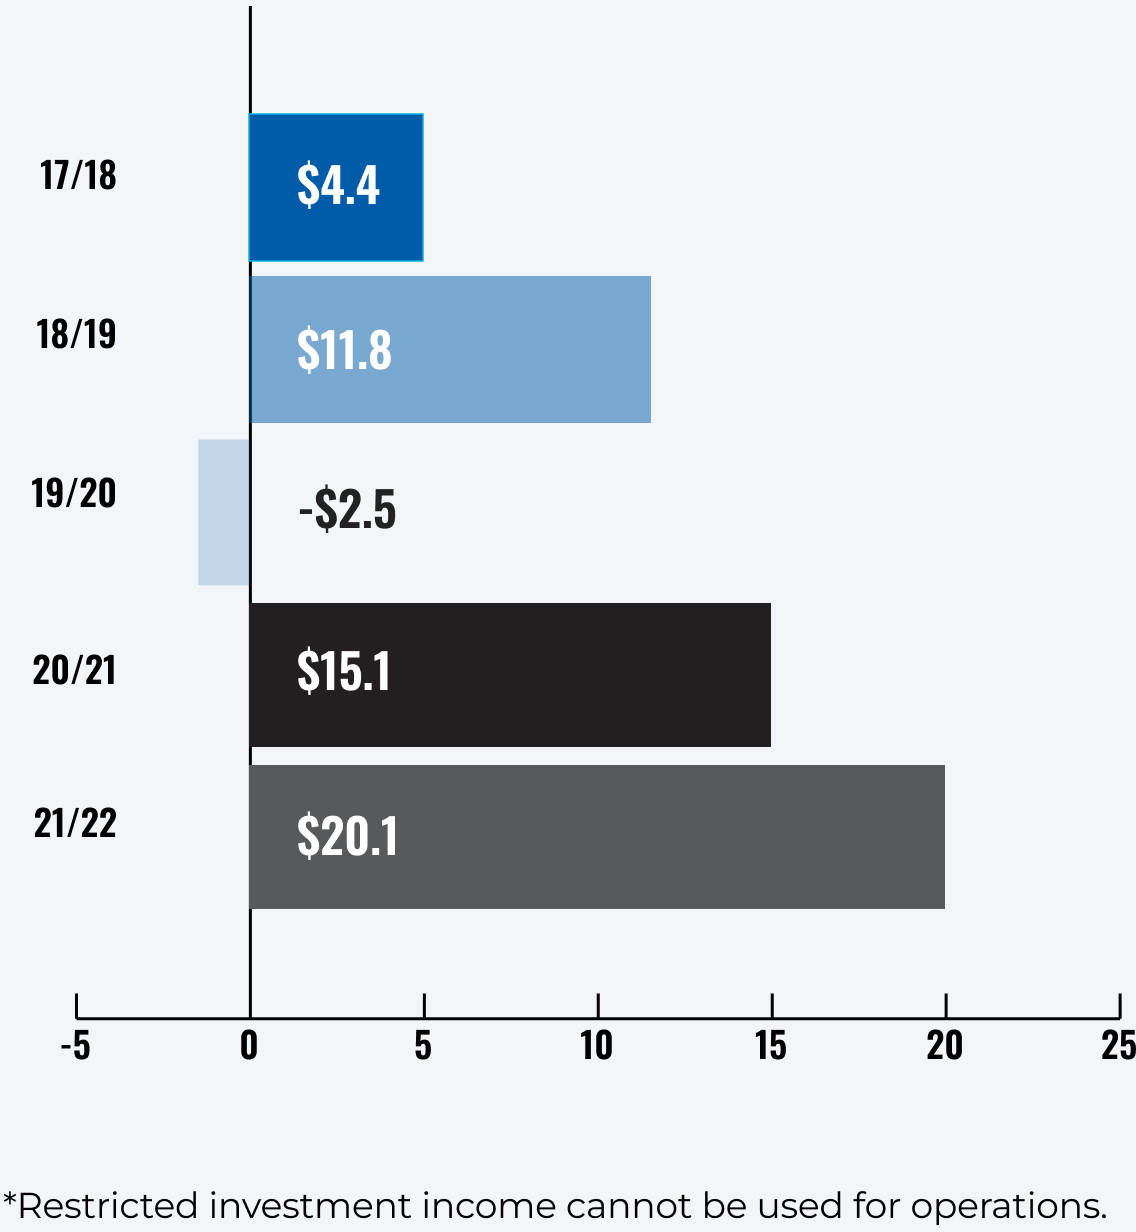
| Restricted Investment Income/(Loss) (In Millions) by Financial Year | Amount (In millions) |
|---|---|
| 2019/2020 | -$2.5 |
| 2020/2021 | $15.1 |
| 2021/2022 | $20.1 |
| 2022/2023 | $14.3 |
| 2023/2024 | $15.1 |
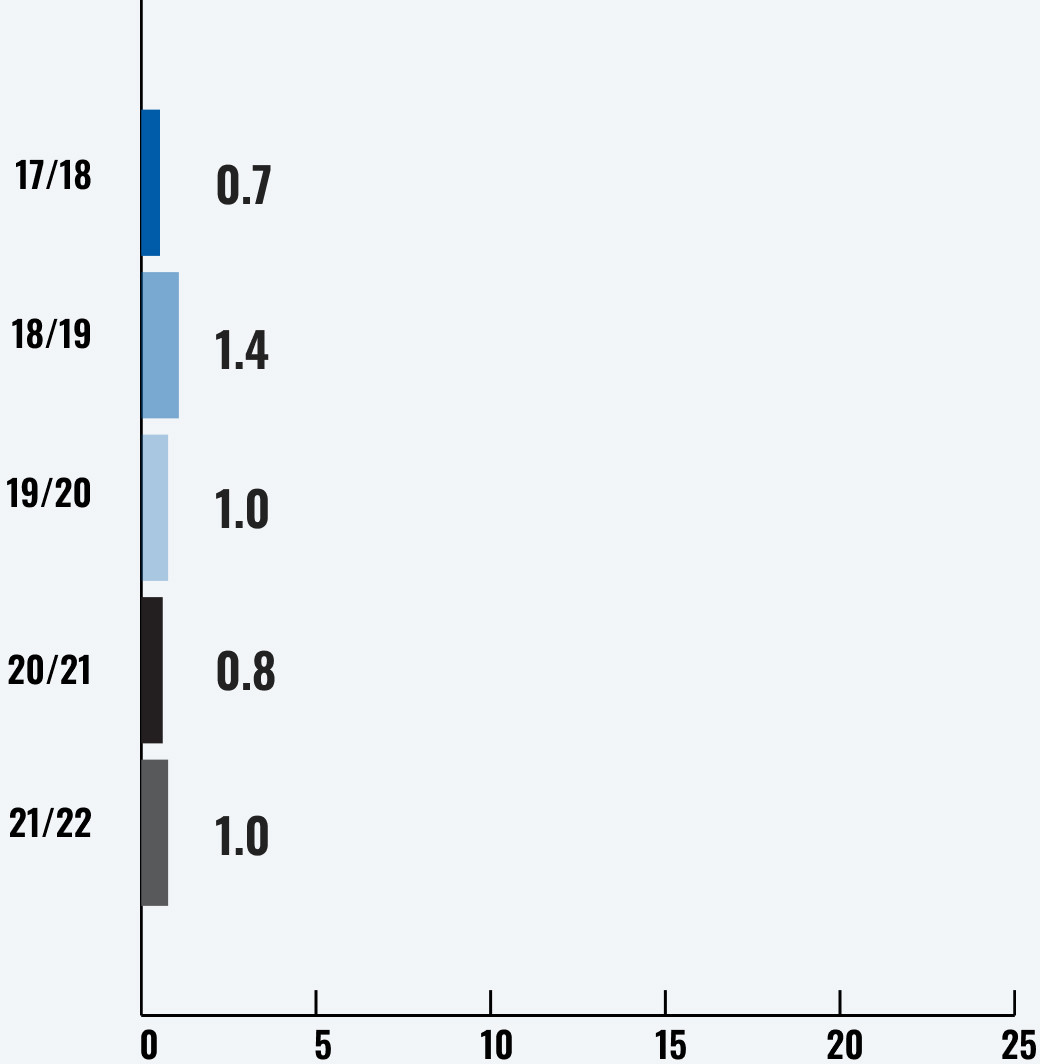
| Unrestricted Investment Income/(Loss) (In Millions) by Financial Year | Amount (In millions) |
| 2019/2020 | $1.0 |
| 2020/2021 | $0.8 |
| 2021/2022 | $1.0 |
| 2022/2023 | $7.7 |
| 2023/2024 | $13.3 |
| Sources of Research Institute Funding (In Millions) | Amount (In millions) | Percentage |
|---|---|---|
| Industry Partnerships and Commercialization Income | $3.7 | 2% |
| External Billings (Core Facilities) | $6.1 | 2% |
| SickKids Foundation | $87.2 | 32% |
| Research Grants and Awards | $174.7 | 64% |
| Total | $297.8 Million |
| Sources of Research Institute Expenditure (In Millions) | Amount (In millions) | Percentage |
|---|---|---|
| Internal Costs | $72.3 | 26% |
| External Grant Funded Costs | $209.7 | 74% |
| Total | $305.5 Million |
| Sources of Total Research Internal Expenditure (In Millions) | Amount (In millions) | Percentage |
|---|---|---|
| Technology and Licensing Expenses | $3.8 | 5% |
| Depreciation and Accretion | $6.0 | 8% |
| Scientists Salaries (Net of $15.5M Recovery) | $6.6 | 9% |
| Debenture Interest | $10.4 | 15% |
| Research Operations (Net of $4.4M Recovery) | $8.0 | 11% |
| Core Infrastructure | $1.9 | 3% |
| Peter Gilgan for Research and Learning | $17.4 | 24% |
| Start-Up and Scientific Support (Net of $5.2M Recovery) | $18.2 | 25% |
| Total | $77.2 Million |
2023-2024 Total Hospital Revenues and Expenses
revenues
(In millions)
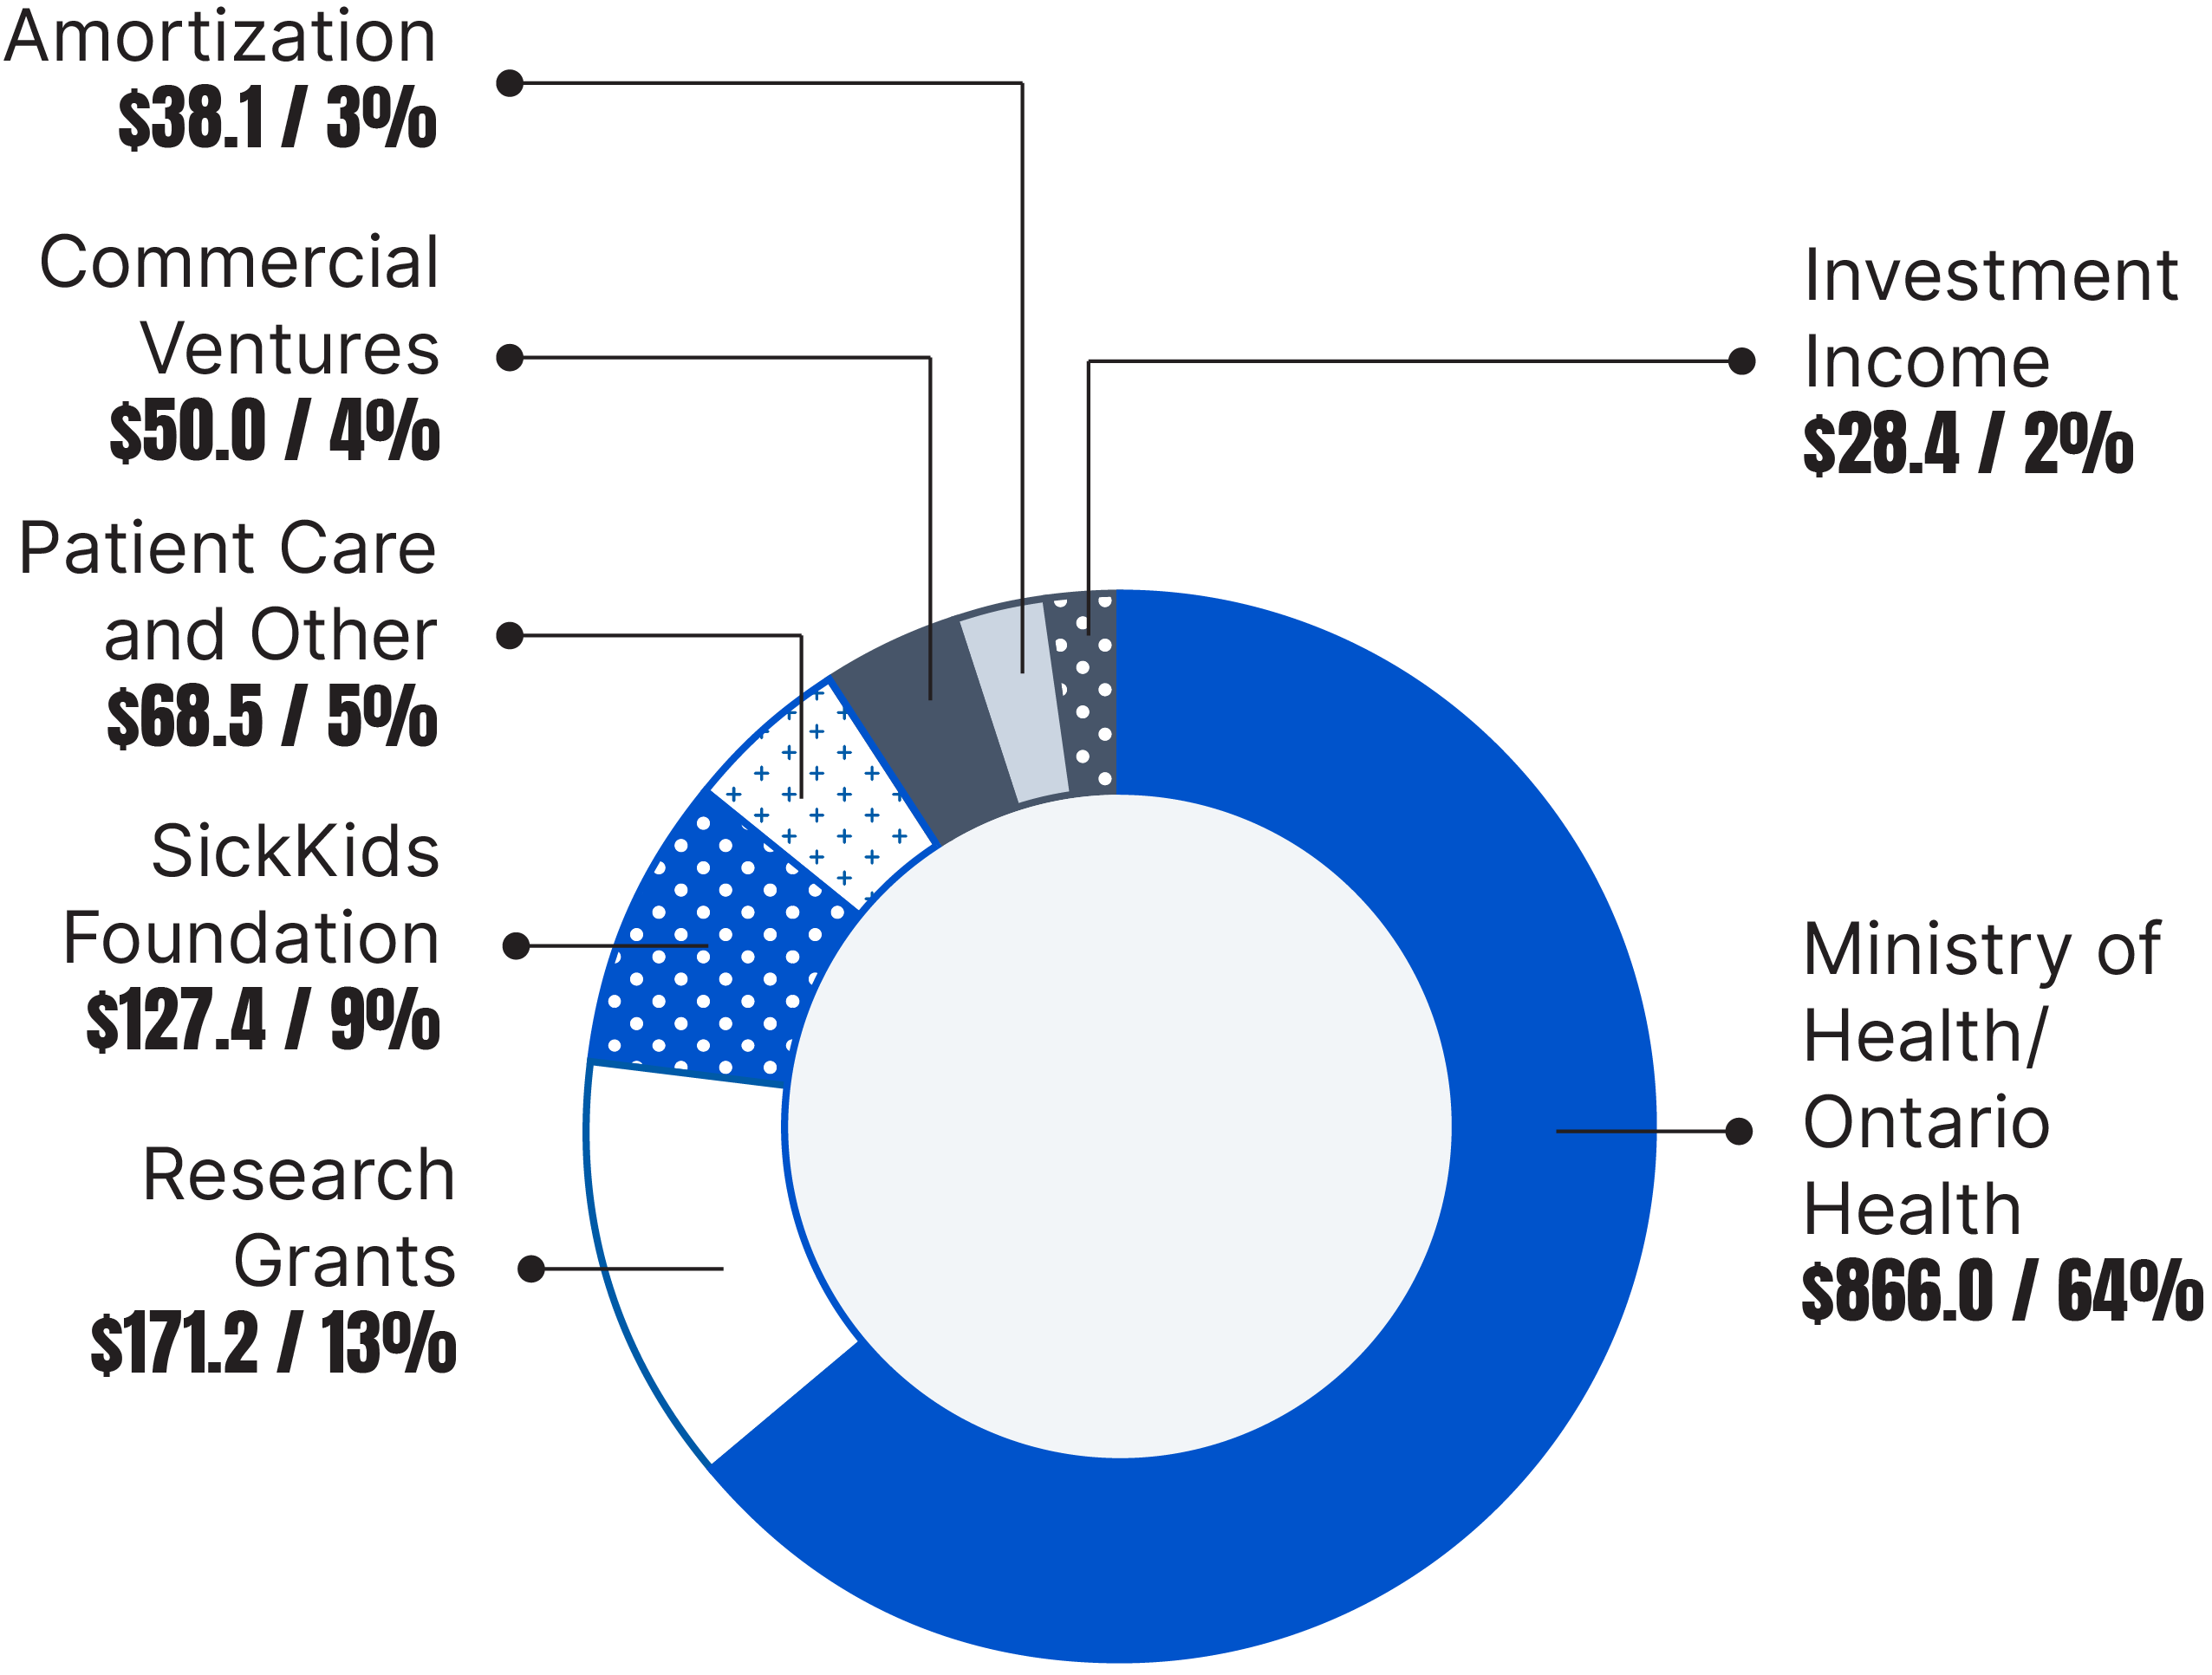
$1.35 billion
expenses
(In millions)
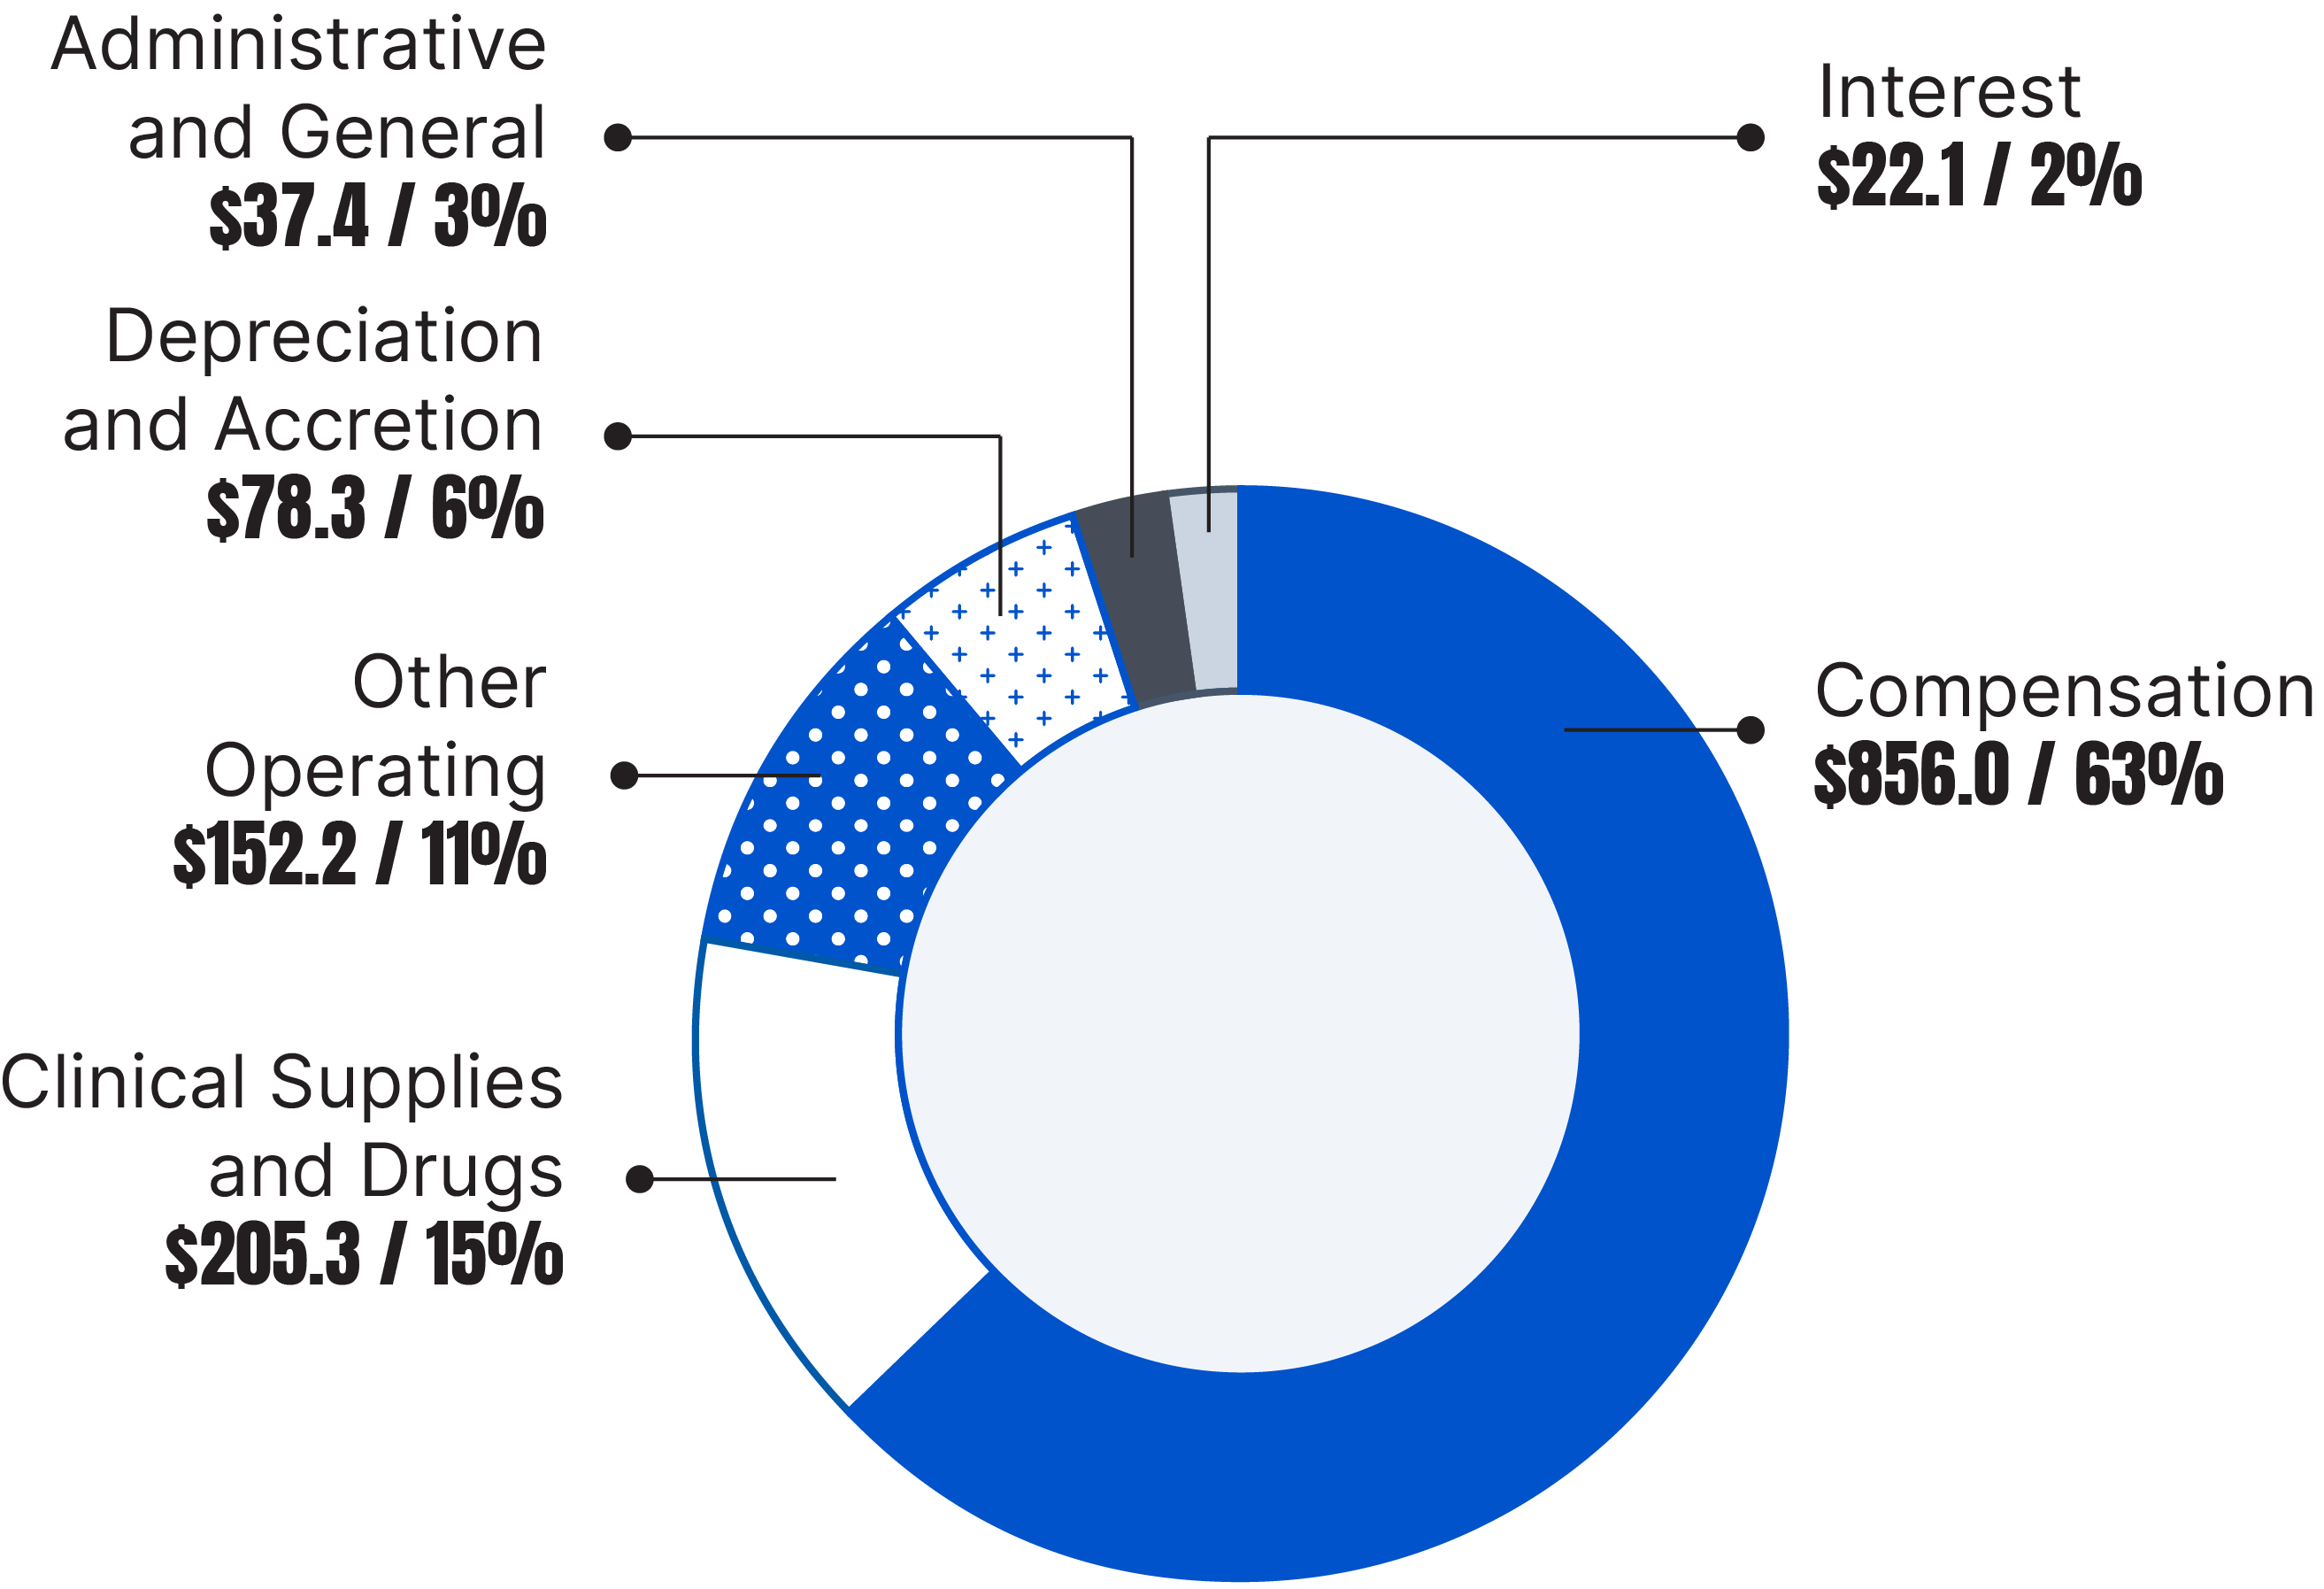
$1.35 billion
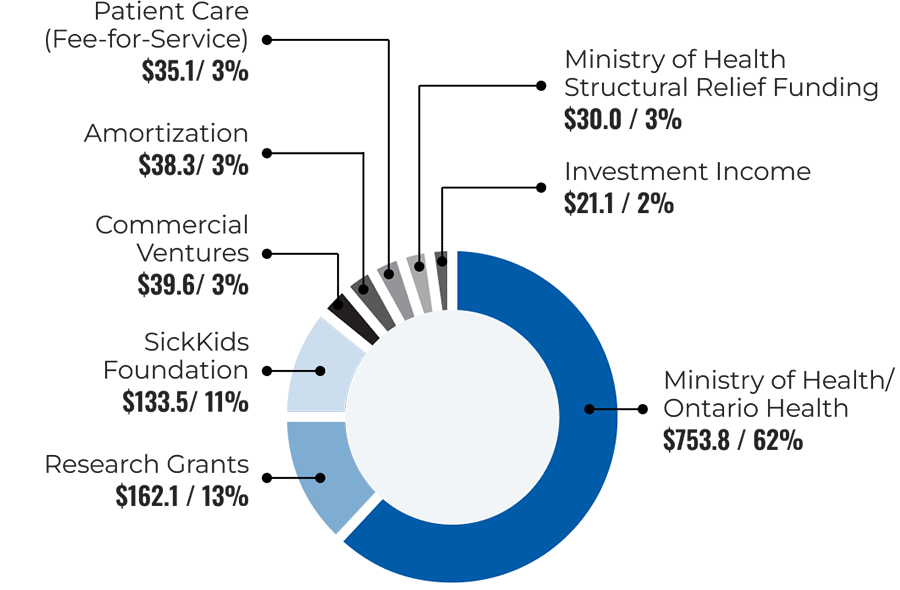
2023-2024 Total Patient Care Revenue and Expenses
revenues
(In millions)
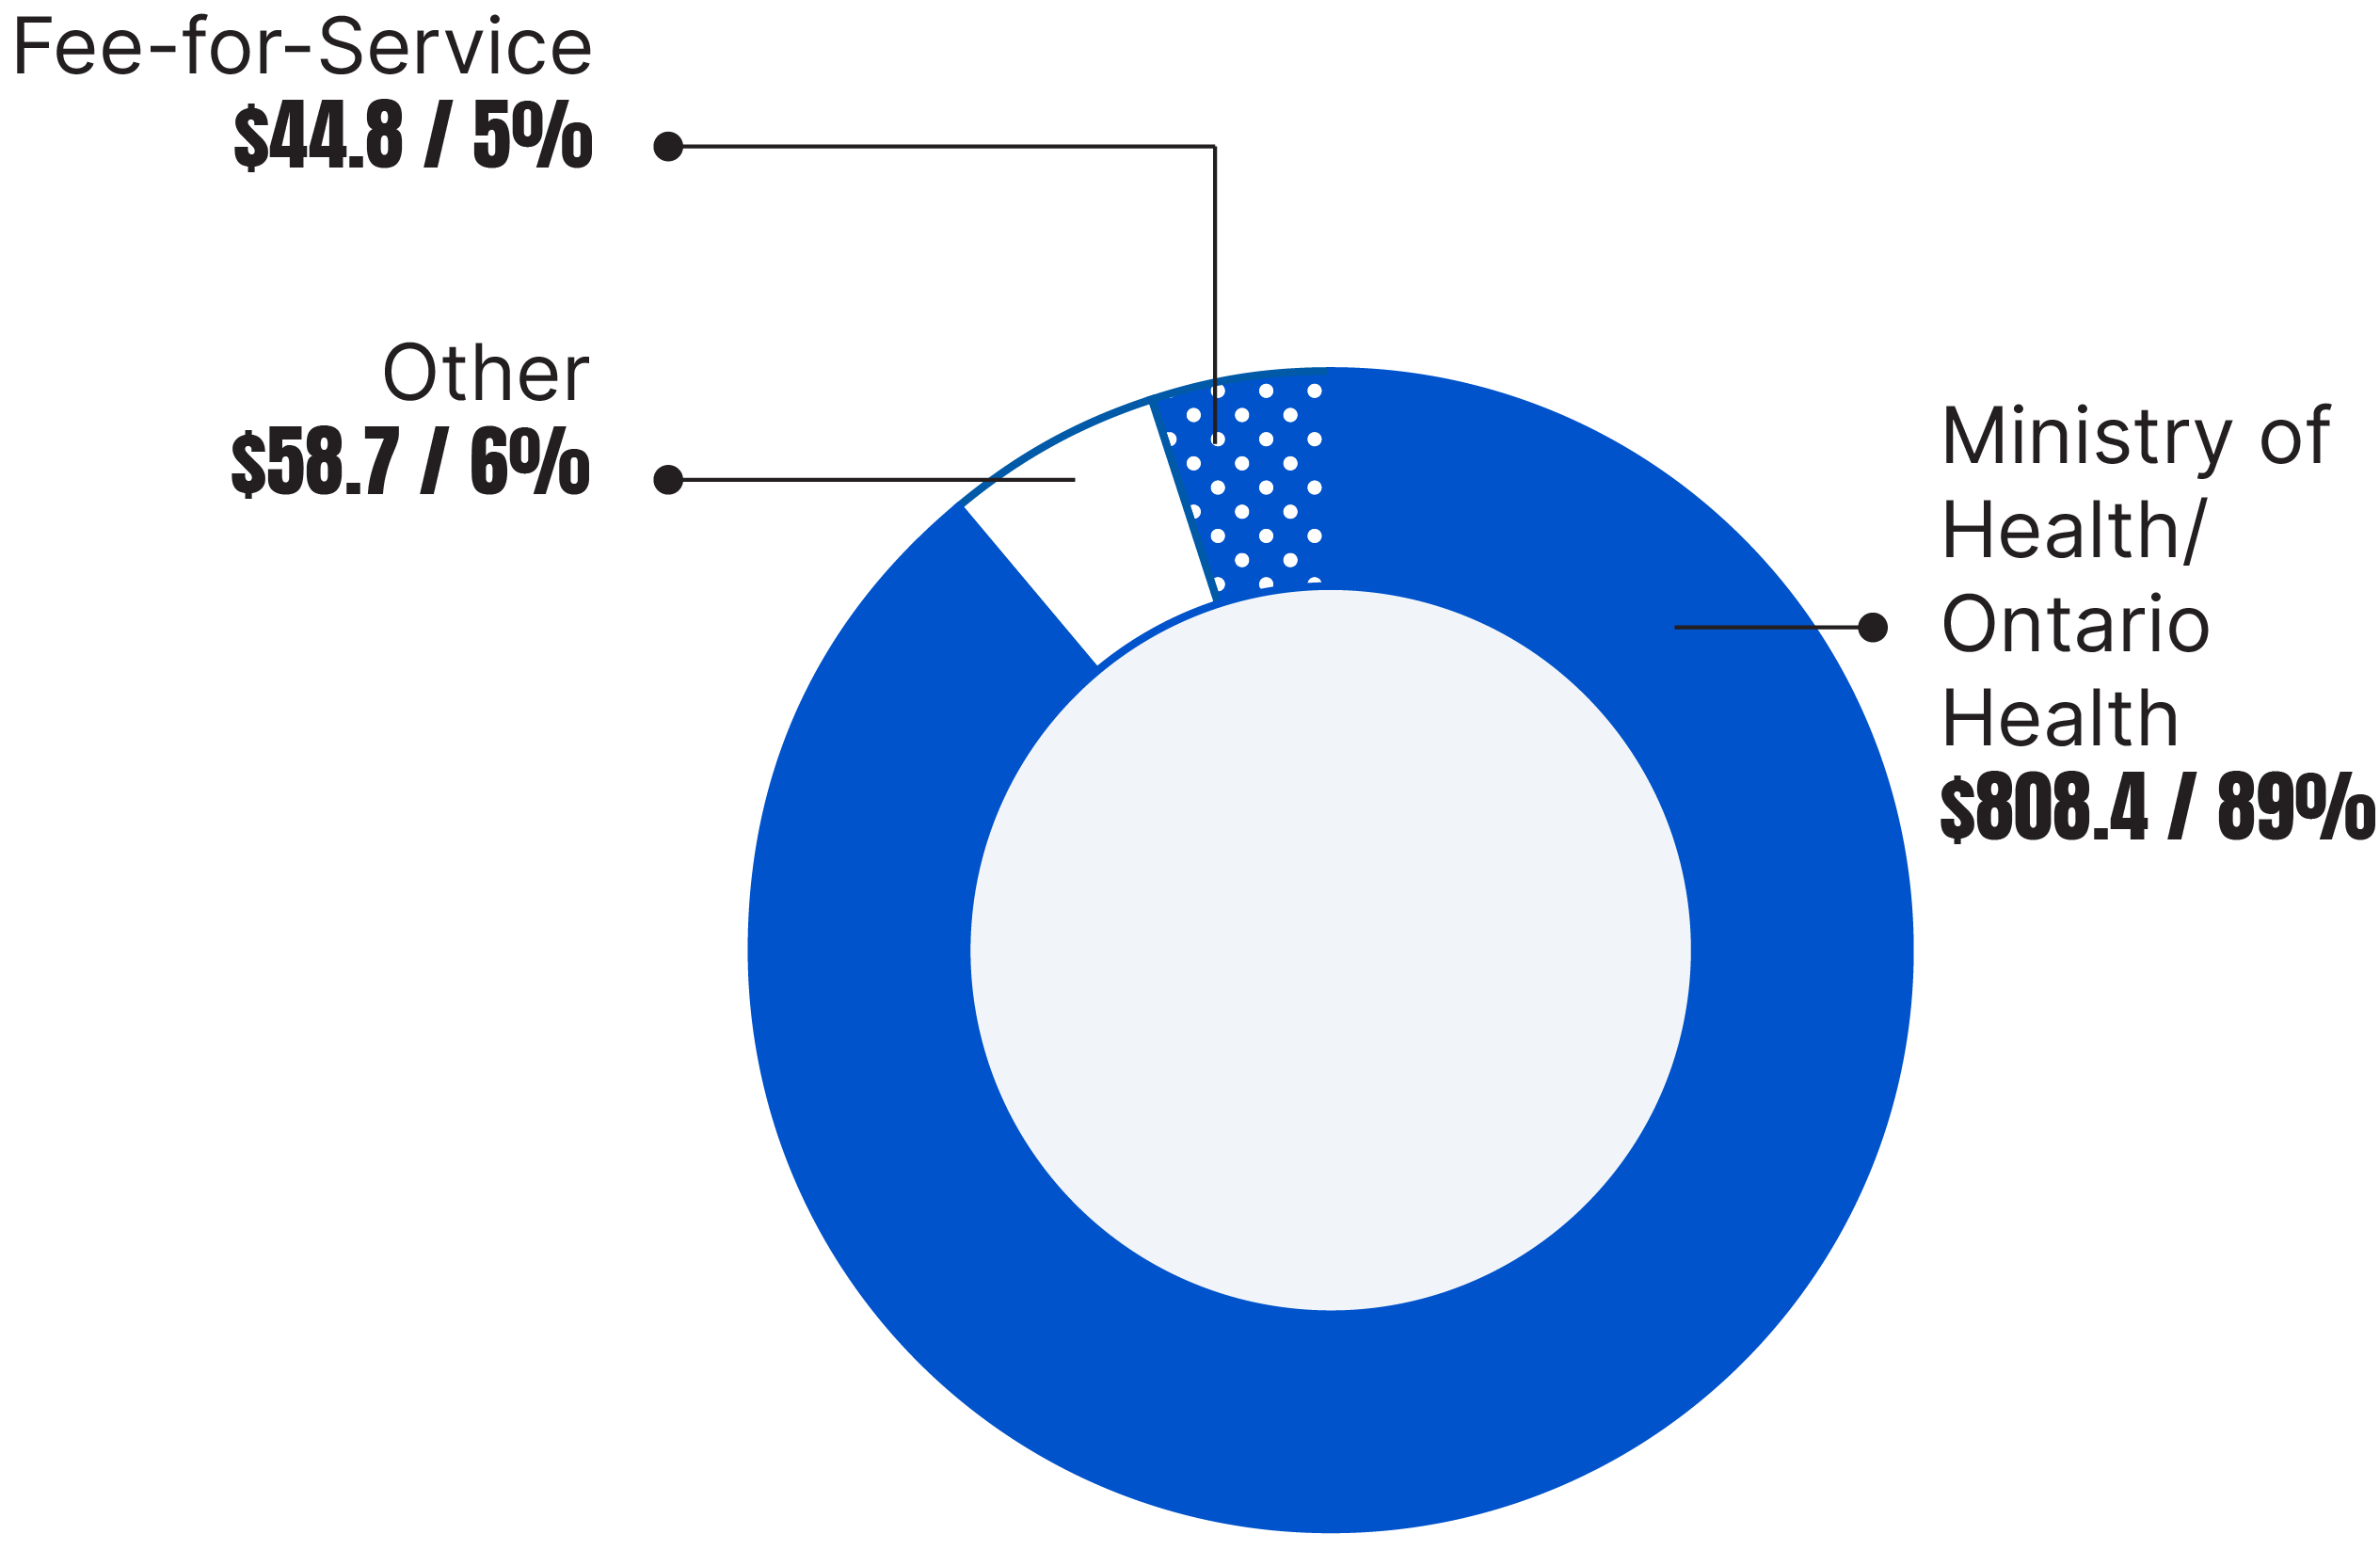

$911.9 million
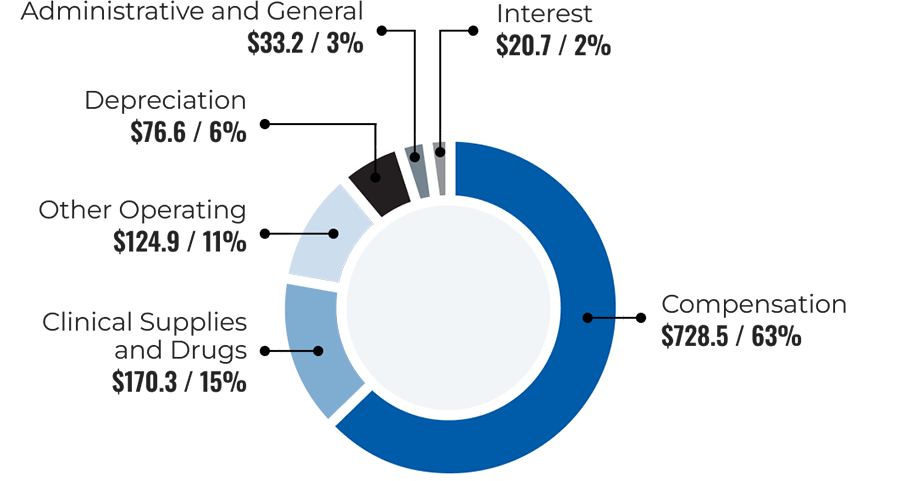
Expenses
(In millions)

$944.8 million
2023-2024 Investment Performance
Hospital Investments
(In millions)
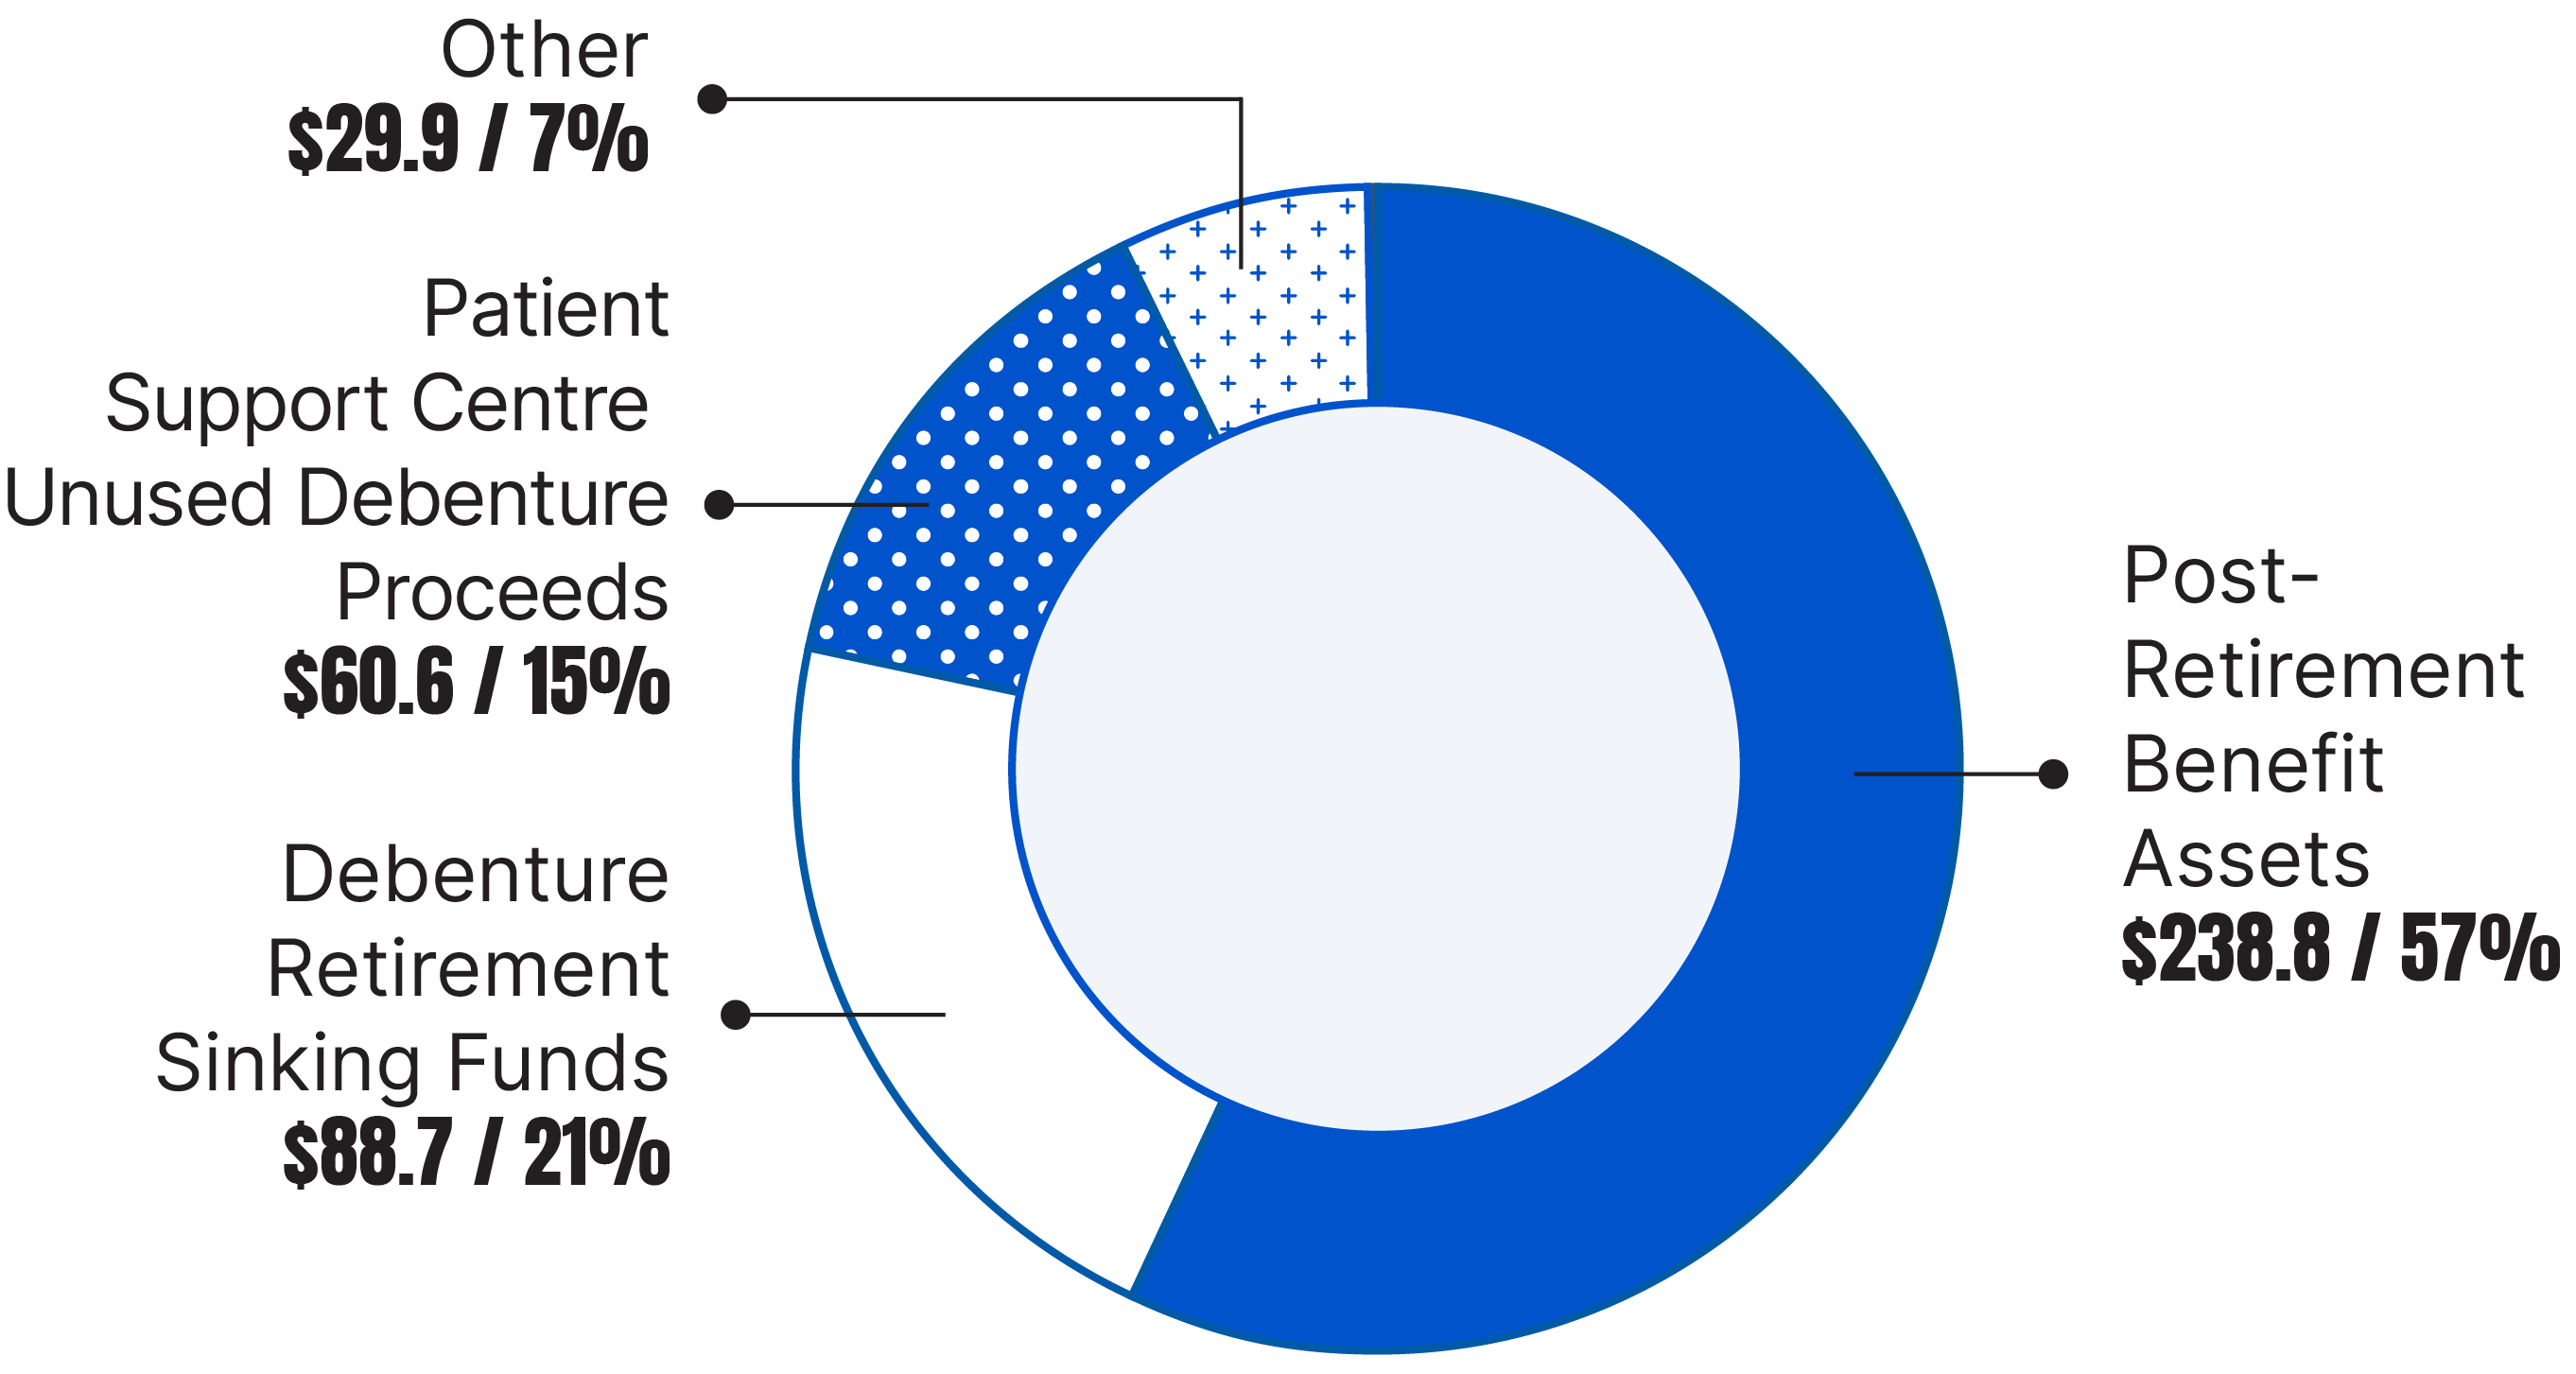

$418.0 million
Investment Income/Loss
(In millions)
Restricted Investment Income/Loss*
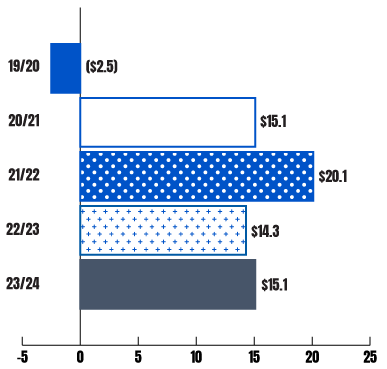
*Restricted investment income cannot be used for operations.
Unrestricted Investment Income

Restricted Investment Income/Loss*
Unrestricted Investment Income
2023-2024 Total Research Institute Revenue and Expenses
Sources of Research Institute Funding
(In millions)
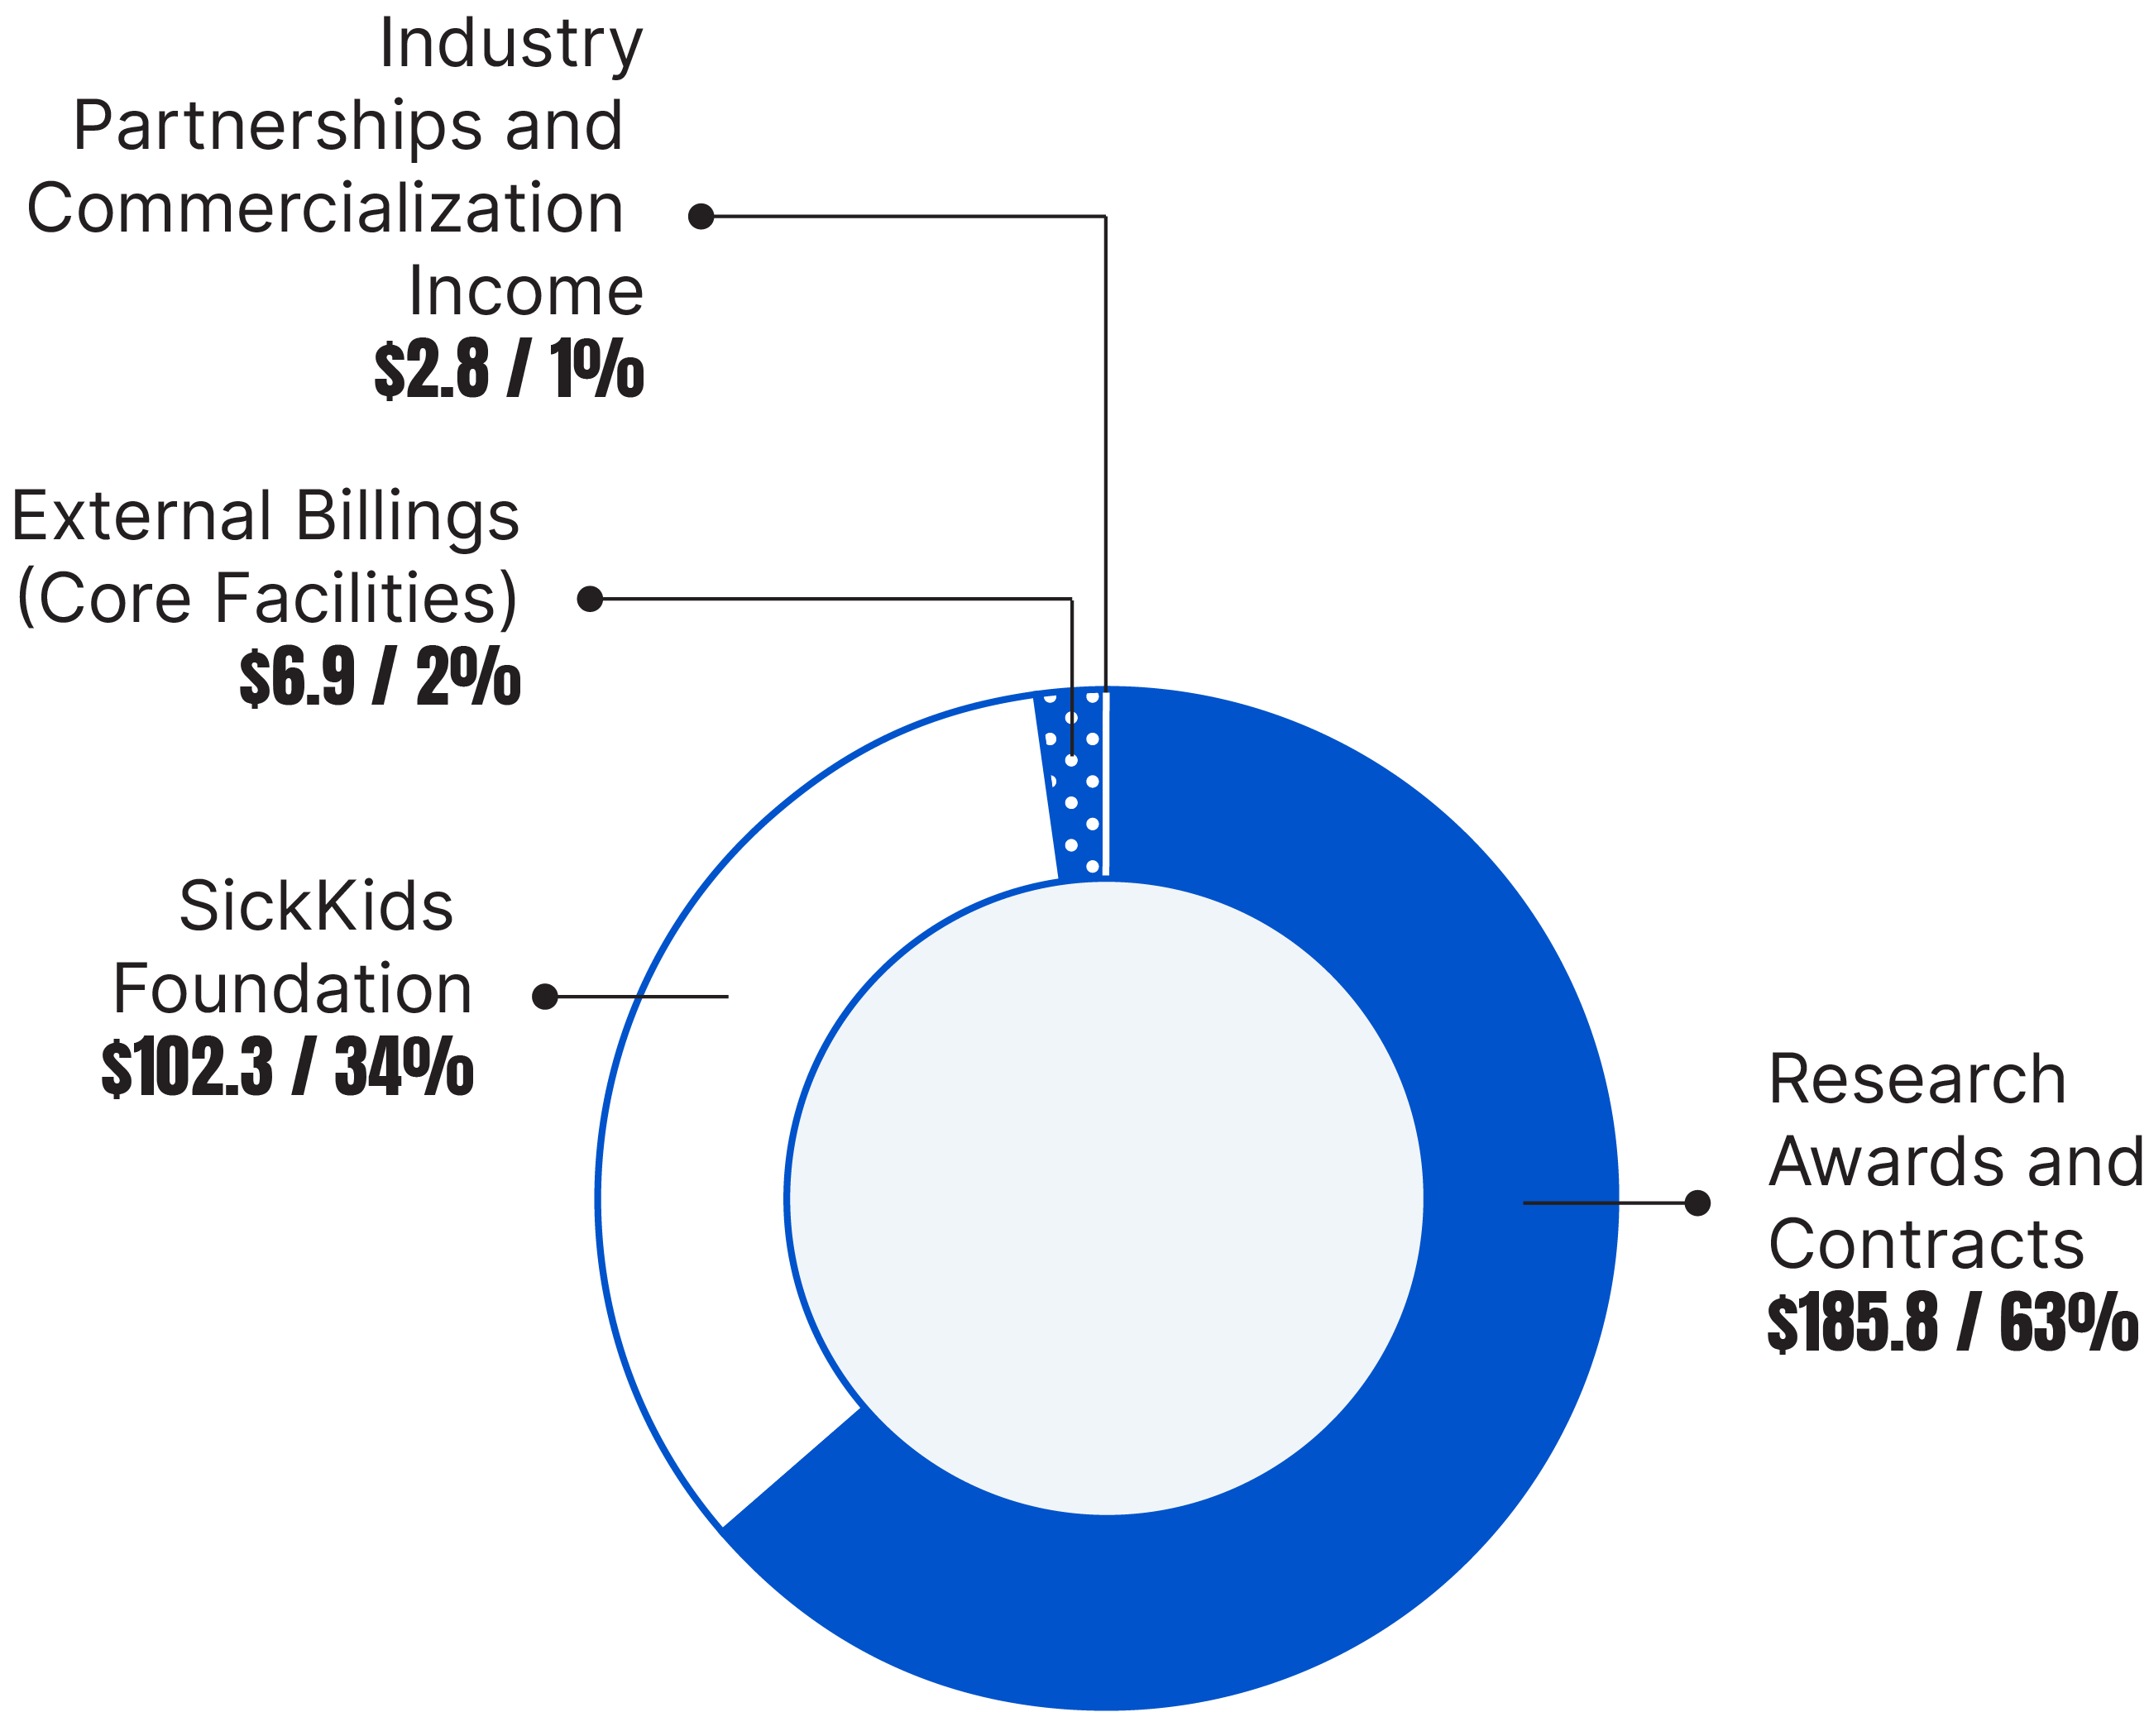

$297.8 million
Research grants and awards sources over $1 million
(In millions)
Secretariat – Research Support Fund
Secretariat – Canada Research Chairs
Total Research Institute Expenditure
(In Millions)
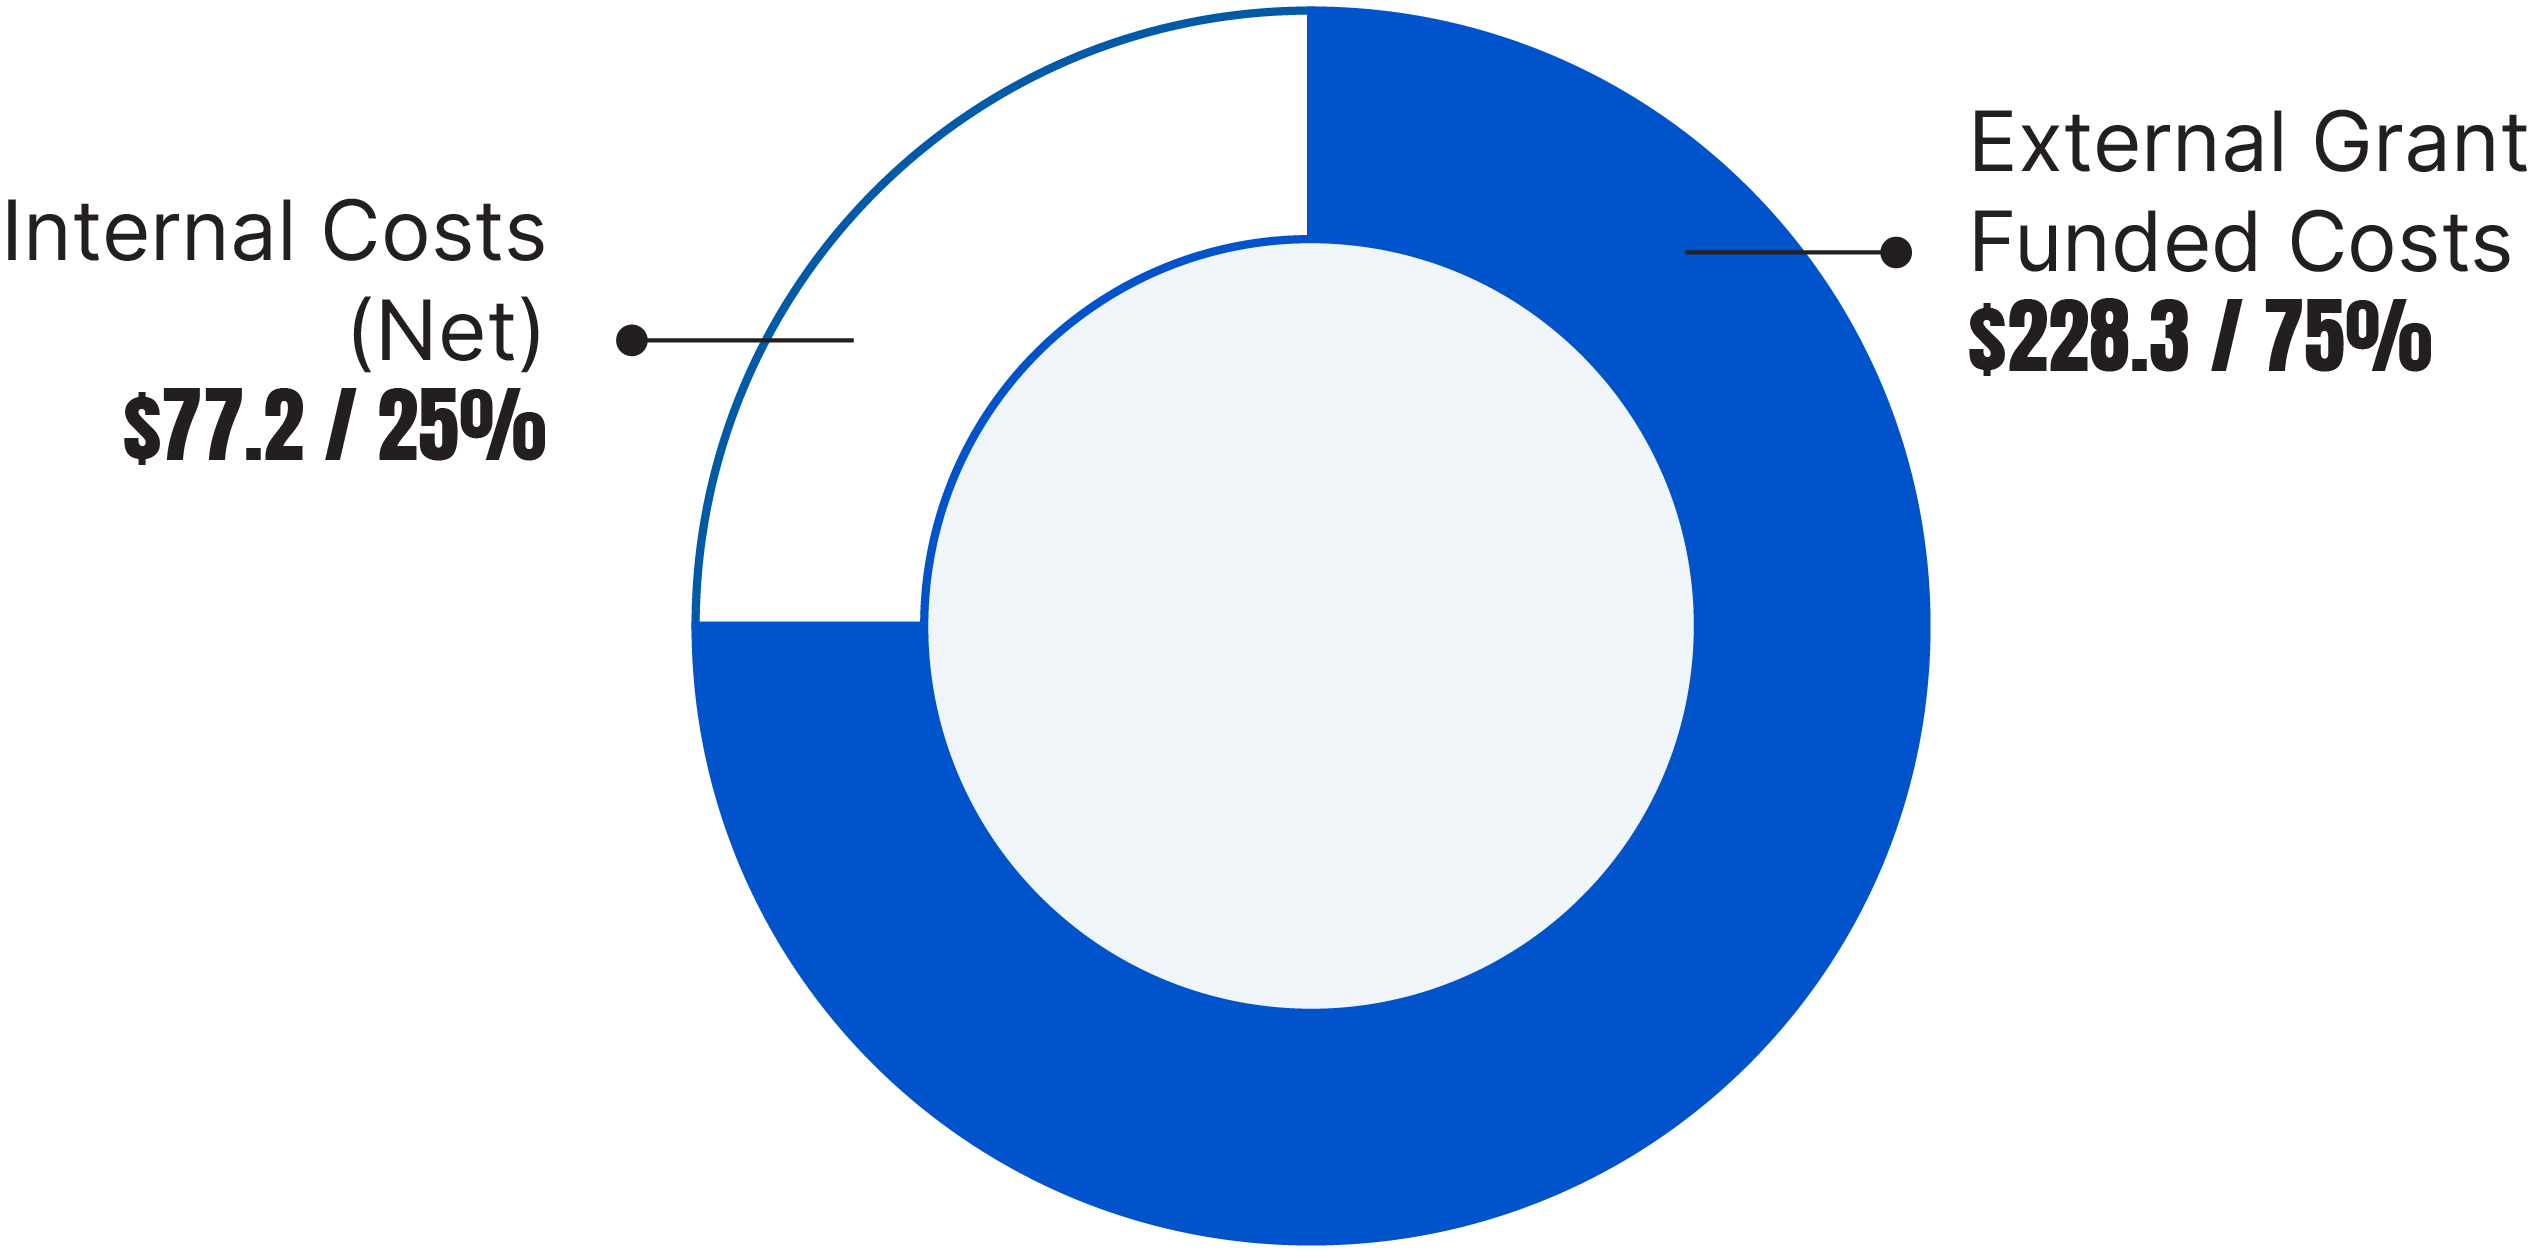

$305.5 Million
Total Research Internal Expenditure
(In millions)
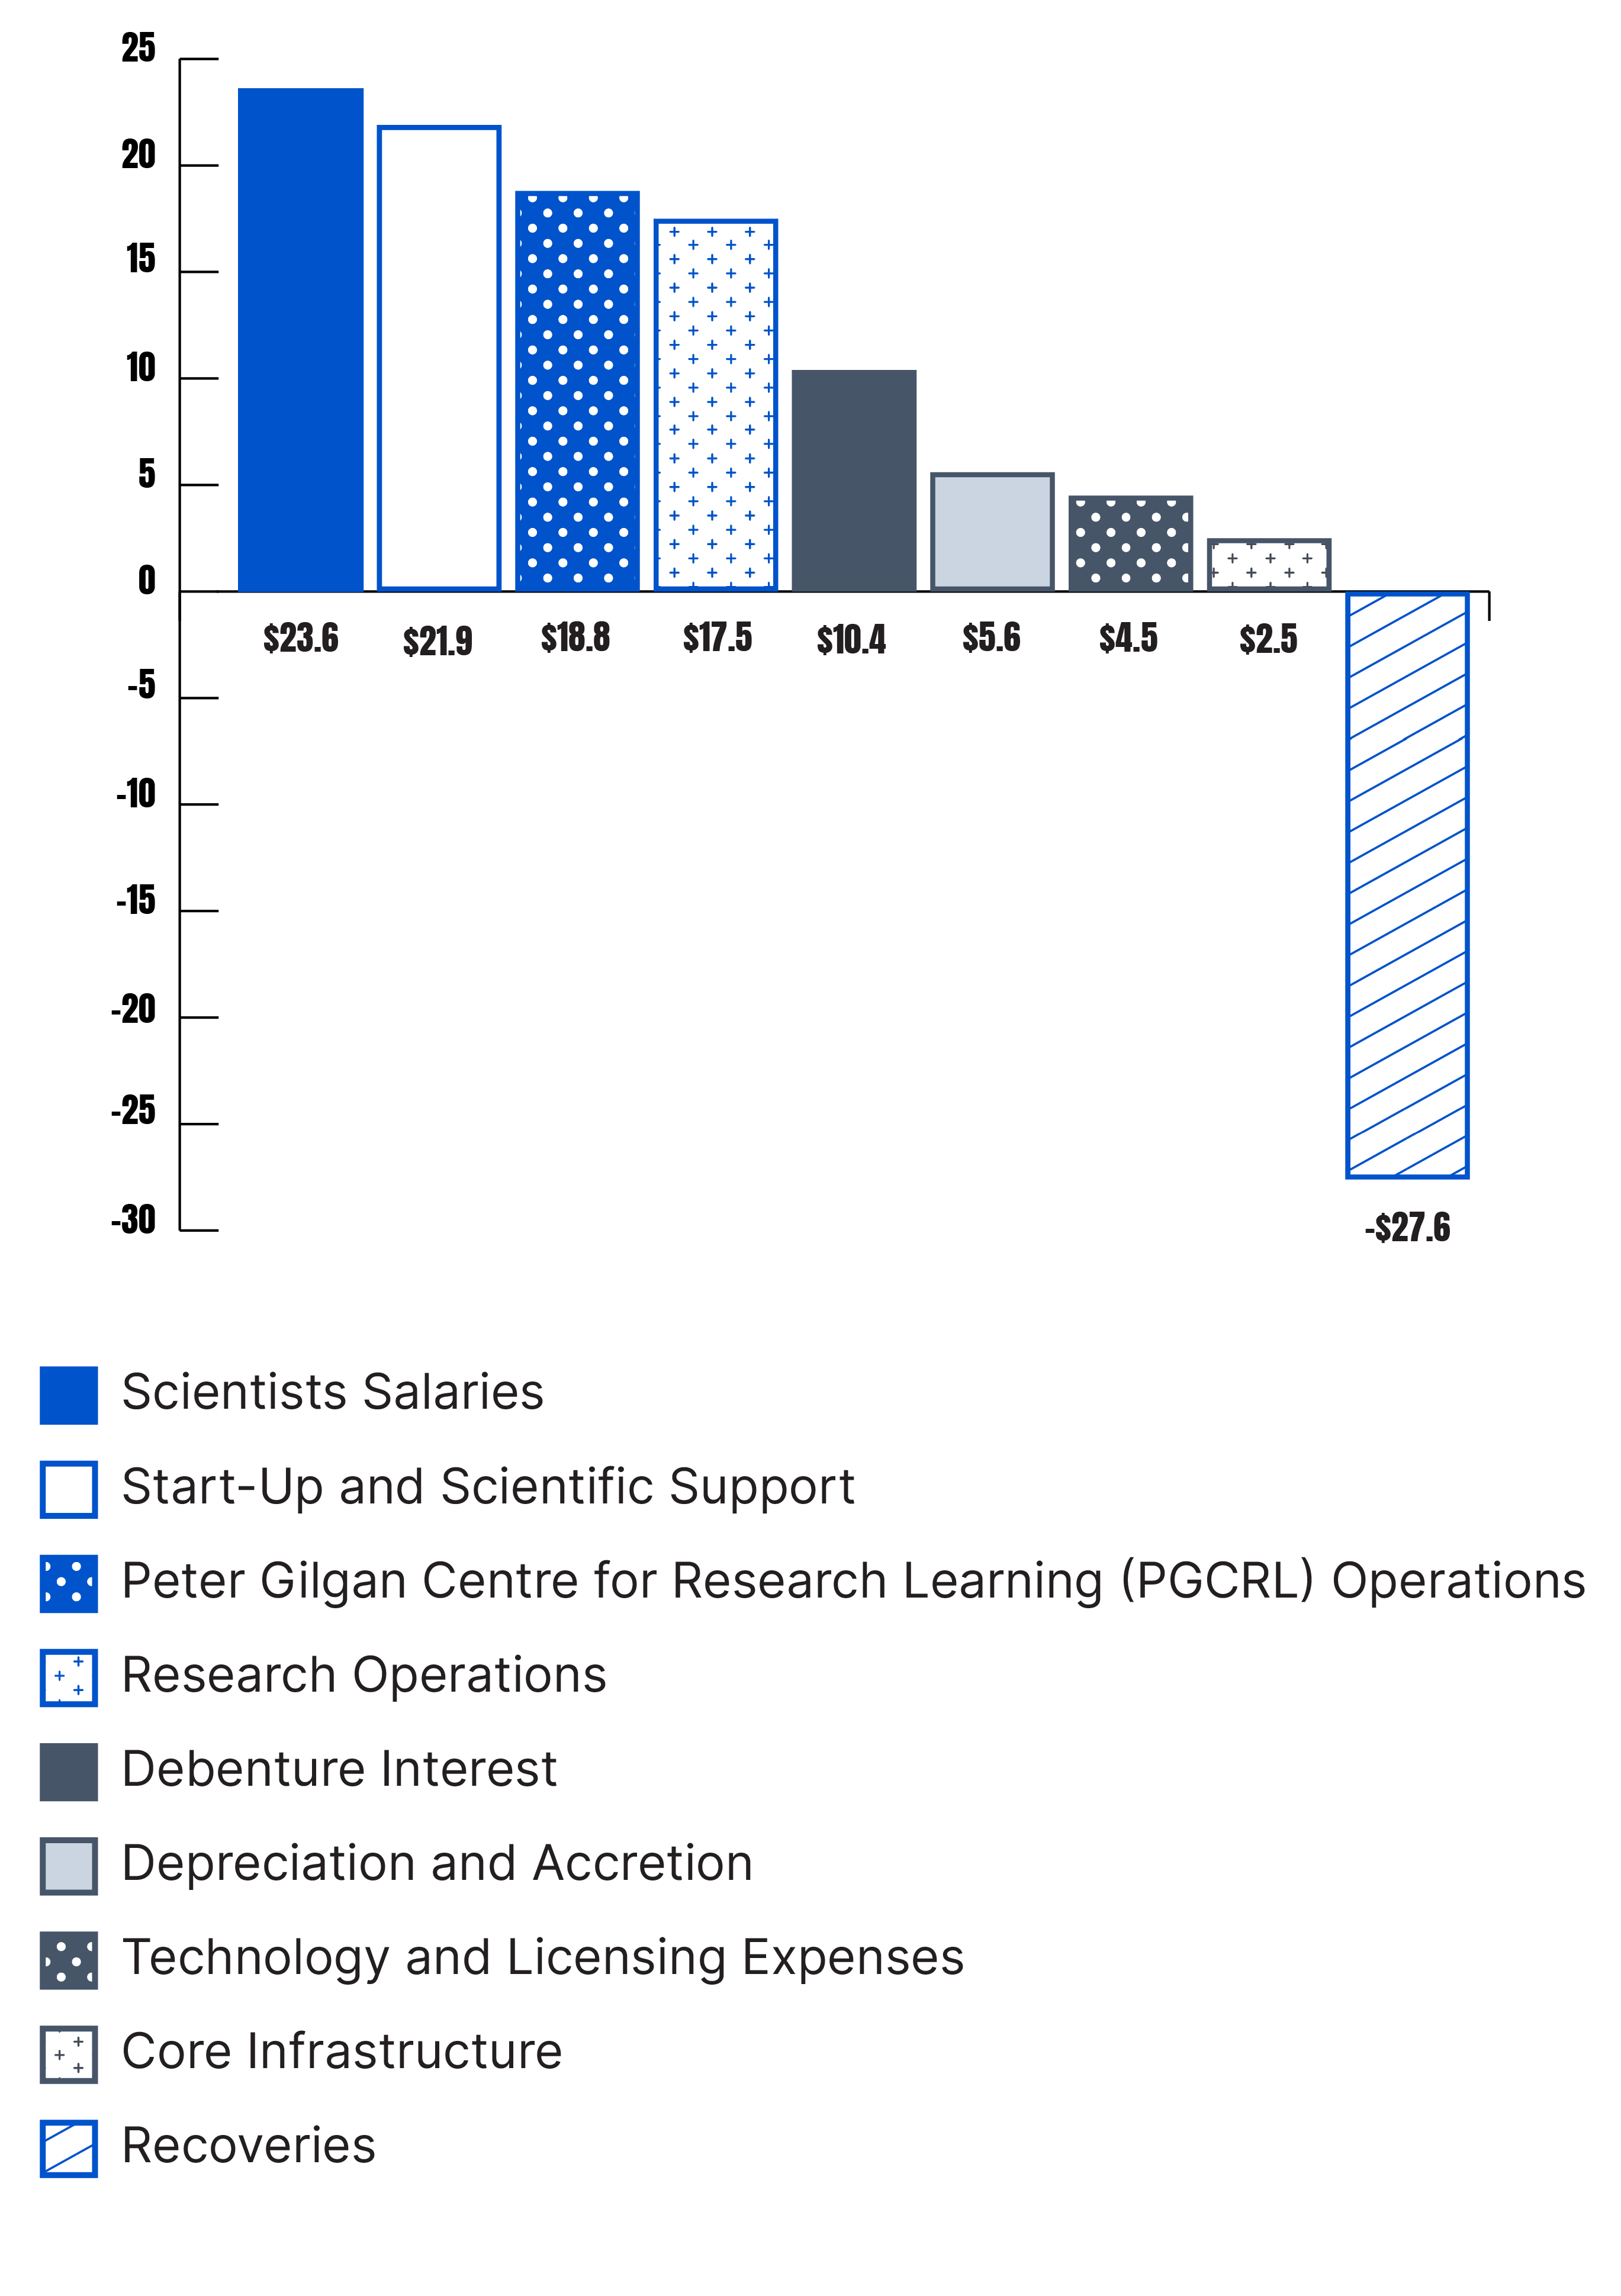

$77.2 million